
Figures & data
Table 1. Global rain/no-rain classification algorithms based on scattering index, SI.
Figure 1. Land use/land cover in the Mahanadi basin (2010).
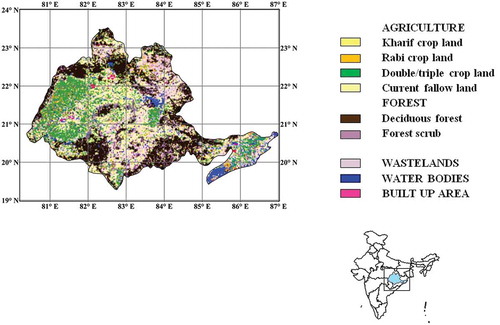
Figure 2. Topography of the Mahanadi basin from the GTOPO digital elevation model. ▴, locations of the automatic weather stations within the basin.
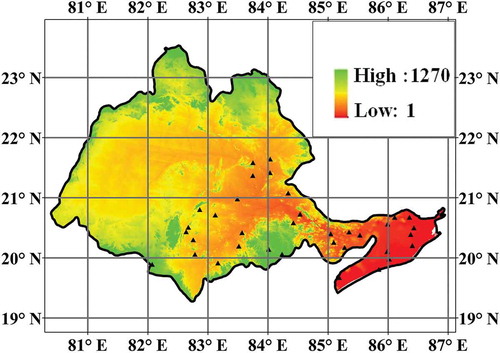
Table 2. Automatic weather stations (AWS) located within the Mahanadi basin.
Figure 3. Flowchart summarizing the methodology adopted.
Figure 4. Relationship of near surface rain rate (NSR) with collocated over-land Tb (from TMI) for the Mahanadi basin.
Table 3. Contingency matrix.
Table 4. Performance statistics used in the study.
Figure 5. Performance diagram showing categorical statistics for the 15 days. The triangles represent each of the 15 case study dates. Their locations on the performance diagram give the values of performance statistics (POD, B, FAR, CSI), with cross hairs representing the confidence interval obtained using 1000 bootstrapped samples from the contingency table. Success ratio = 1 − FAR.
Table 5. Results of dichotomous classification using proposed model for the 15 days.
Table 6. Results of dichotomous classification based on rainfall type for the 15 days.
Figure 6. Performance diagram showing categorical statistics for stratiform rainfall (as explained for ).
Figure 7. Accumulated rainfall over the Mahanadi basin during JJAS 2011 showing (a) convective rainfall and (b) stratiform rainfall.
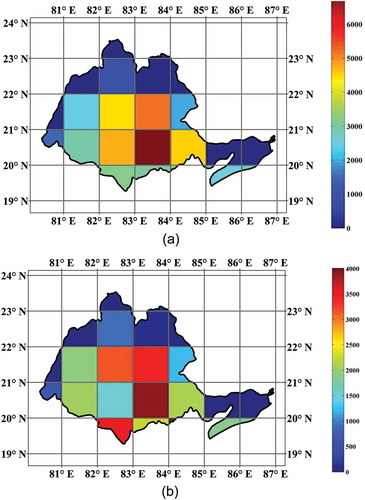
Figure 8. TRMM 3B42 product showing accumulated rainfall (mm) for the Mahanadi basin on (a) 2 July 2011 and (b) 21 July 2011.
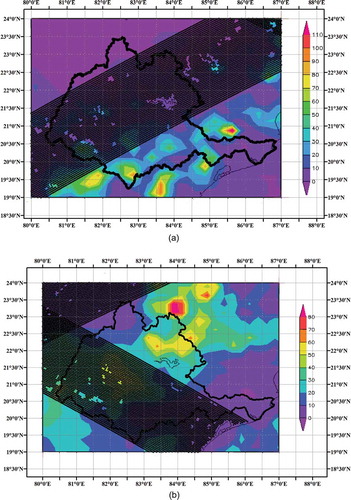
Table 7. Results of proposed RNC algorithm validated with AWS raingauges and PR rainflags.