Figures & data
Figure 1. Map of the Makhazine catchment (North Morocco, Maghreb region) with the locations of the raingauges (circles).
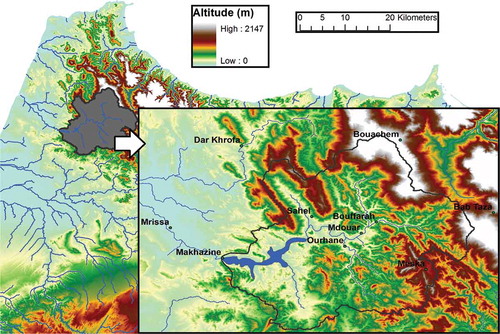
Table 1. List of raingauge stations in the Makhazine catchment.
Table 2. Description of the different satellite rainfall products.
Figure 2. Cumulative distribution function of the GR4J parameters (X1, X2, X3, X4; for explanation of model parameters see Section 2.4) from the database of 900 catchments of Perrin et al. (Citation2008).
Figure 3. Mean monthly areal precipitation (left) and annual precipitation totals for the catchment, computed from the different interpolated datasets of precipitation.
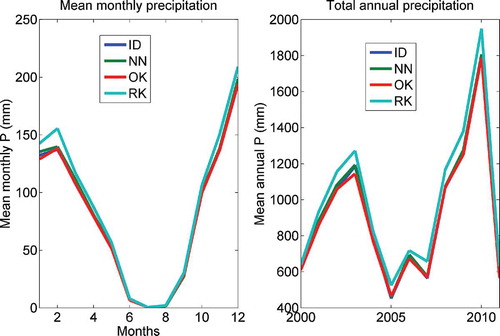
Figure 4. Cross-validation results for the daily precipitation interpolation methods.
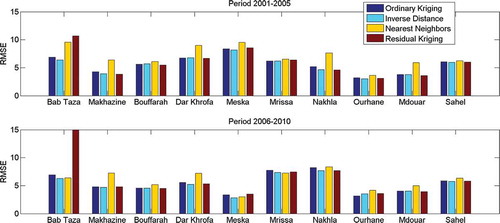
Table 3. Mean and standard deviation of GR4J model parameters and mean KGE for the 100 best simulations obtained with the different interpolated precipitation datasets.
Table 4. Mean and standard deviation of GR4J model parameters and mean KGE for the 100 best simulations obtained TRMM-3B42 v7 precipitation.
Figure 5. Boxplots of the 100 best simulations, in terms of KGE values, of the GR4J model driven by the four different interpolated precipitation datasets (ID, OK, NN, RK). The boxes have lines at the lower quartile, median and upper quartile values; the whiskers extend from each end to the most extreme values.
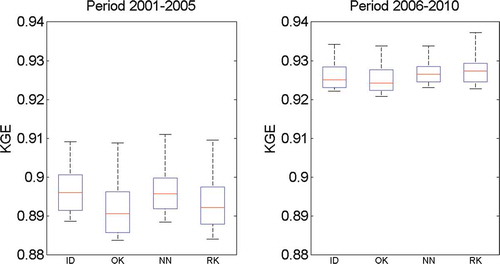
Figure 6. Boxplots of validation results for the 100 best parameters sets obtained during the period 2001–2005 (2006–2010) on the period 2006–2010 (2001–2005).
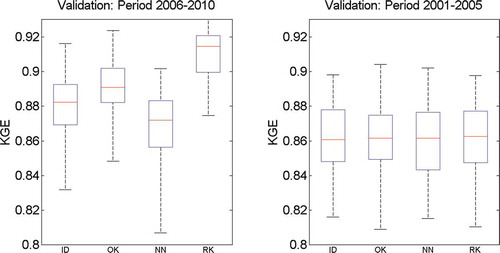
Figure 7. Comparison of mean monthly precipitation (left) and annual precipitation (right) totals for the Makhazine catchment from observed precipitation (inverse distance interpolation) and the different satellite rainfall products during the common period.
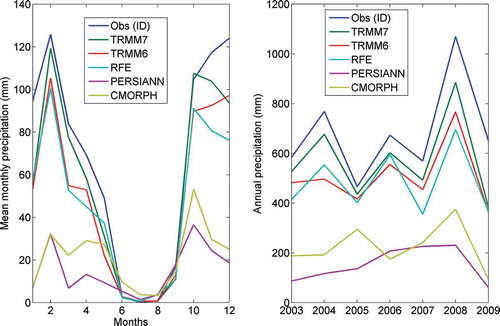
Figure 8. Ratio of wet days (P > 0) in observed or satellite precipitation data.
Figure 9. Cumulative distribution function of the wet days in observed or satellite precipitation data during the common period for all datasets 2003–2009 (JJA excluded).
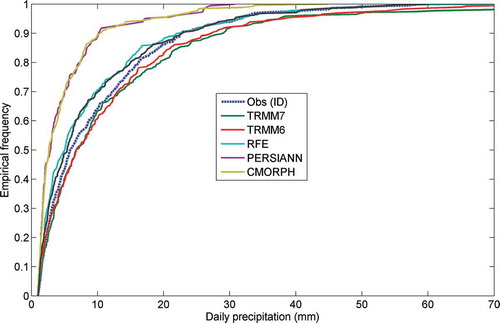
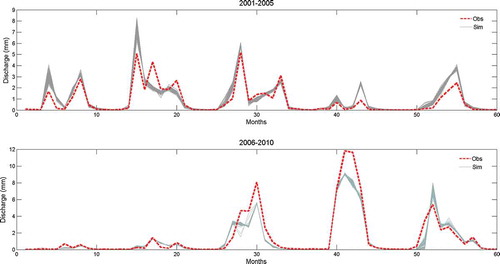
Figure 10. Validation results of the monthly simulated discharge by the GR4J model forced by TRMM-3B42 v7 data. For the 2001–2005 period (upper panel), the model is run with the 100 best parameter sets obtained during 2006–2010 and for 2006–2010 (lower panel) the 100 parameters sets selected are those obtained during 2001–2005.