Figures & data
Figure 1. Water resources systems adaptation: a comparison between the classical top-down approach (inner loop) and a more flexible and resilient bottom-up approach (outer loop). Both (black and red) arrows represent causal influence and temporal sequence.
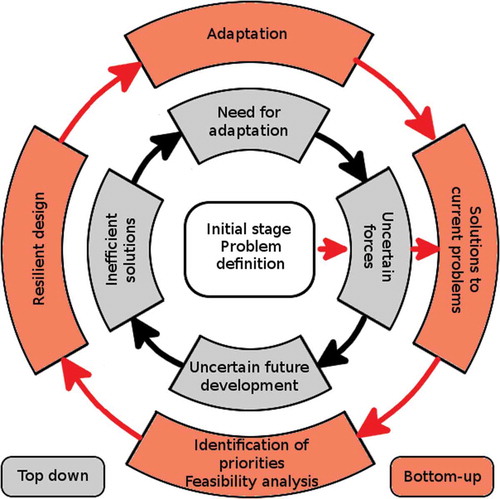
Figure 2. Workflow of the bottom-up approach for water resources systems (WRS) adaptation. This continuous workflow is based on (1) assessment of WRS status, (2) prioritization of WRS targets and (3) the decision-making process.
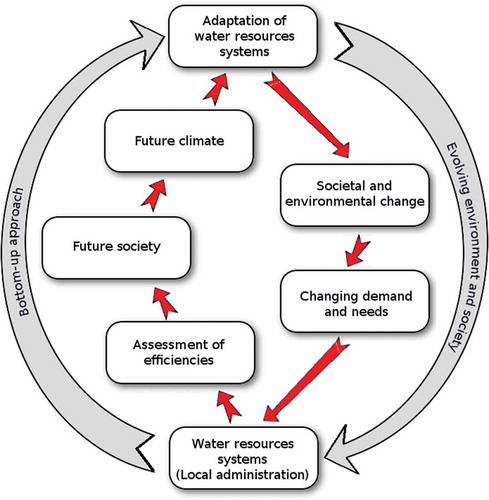
Figure 3. Human impacted areas on the biosphere, identified through mapping of roads, railways and settlement density (by T. Hengl (http://globio.info) [CC BY-SA 3.0 (http://creativecommons.org/licenses/by-sa/3.0)], via Wikimedia Commons).
![Figure 3. Human impacted areas on the biosphere, identified through mapping of roads, railways and settlement density (by T. Hengl (http://globio.info) [CC BY-SA 3.0 (http://creativecommons.org/licenses/by-sa/3.0)], via Wikimedia Commons).](/cms/asset/9081ed00-1462-4826-bf11-d07f9ab972a1/thsj_a_1230674_f0003_oc.jpg)
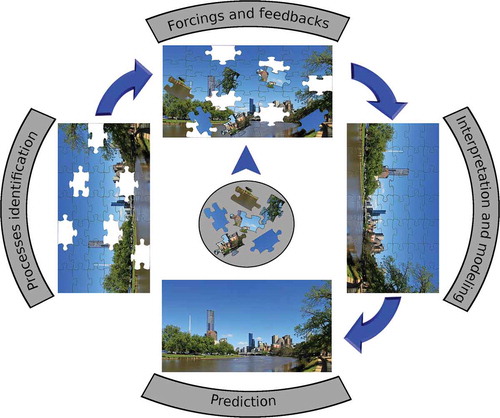
Figure 4. Identification and interpretation of processes, prediction and modelling in socio-hydrology.