Figures & data
Figure 1. Location map with climate and USGS stations in the Muskingum watershed. WETN: herbaceous wetland; WETF: wetland forest; WATR: open water; URMD: urban medium density; URLD: urban low density; URHD: urban high density; UIDU: industrial; SWRN: bare rock or sandy or clays; RNGE: grassland; RNGB: shrubland; HAY: hay; FRST: mixed forest; FRSE: evergreen forest; FRSD: deciduous forest; and AGRR: agriculture.
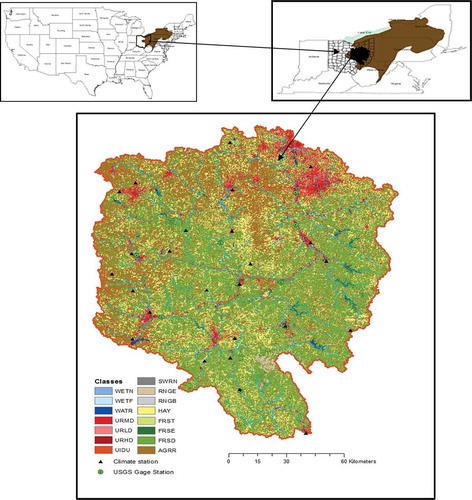
Figure 2. Utica shale wells in the State of Ohio, USA, from January 2011 to September 2013, indicating more wells in Eastern Ohio.
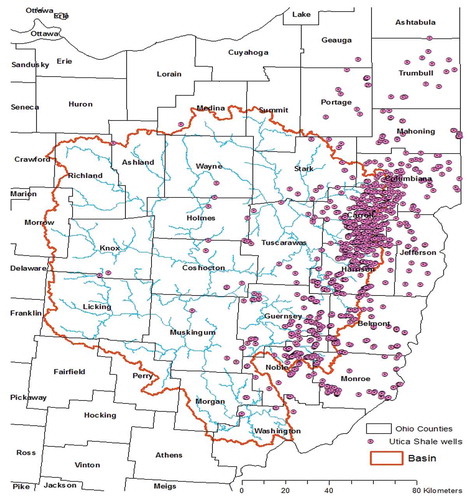
Figure 3. Tuscarawas sub-watershed (shaded) in the upper part of the Muskingum watershed, where drilling for hydraulic fracking has been increasing significantly.
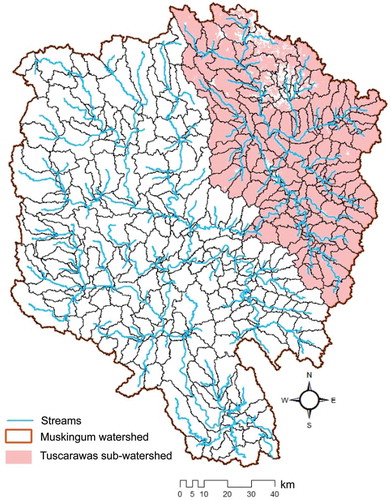
Figure 4. Change in number of Utica wells in Ohio from January 2011 to May 2014.
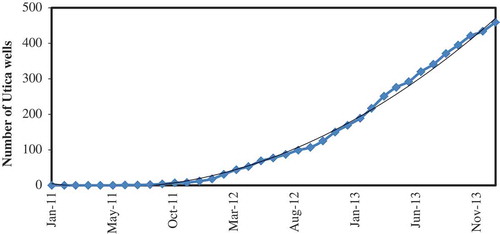
Table 1. Data used for SWAT model development in the Muskingum watershed.
Table 2. Water withdrawal for hydraulic fracking per well in the Muskingum watershed, 2011–2013.
Table 3. List of predictors used in the SDSM model to downscale the NCEP re-analysis data.
Table 4. Statistical criteria measuring the daily performance of the SWAT model for the calibration (2002–2009) and validation (1995–2001) periods.
Table 5. Statistical criteria measuring the monthly performance of the watershed model for the calibration (2002–2009) and validation (1995–2001) periods.
Table 6. Characteristics of the various scenarios used for analysis.
Figure 5. The 7-day monthly minimum flow during the low-flow period for baseline and future scenarios analysed for the current climate period in the Muskingum watershed.
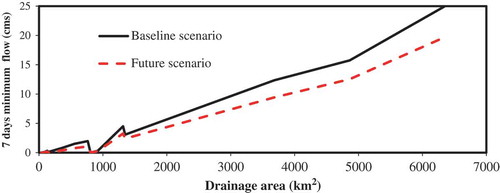
Figure 6. Percentage difference in 7-day minimum flows between the baseline and future hydraulic fracking scenarios simulated using current climate data in the Muskingum watershed.
Figure 7. Percentage difference in annual average flows between the baseline and future hydraulic fracking scenarios simulated using current climate data in the Muskingum watershed.
Figure 8. The 7Q10 flows for the baseline and future projected hydraulic fracking scenarios using the 30-year projected climate dataset generated by the SDSM.
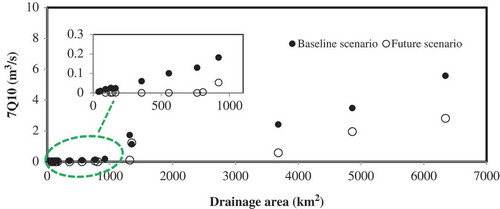
Figure 9. Percentage difference in 7Q10 between the baseline and projected future hydraulic fracking scenarios using the 30-year projected climate dataset generated by the SDSM.
Figure 10. The 4B3 and 1B3 flows for the baseline vs future fracking scenarios using the 30-year climate dataset generated by the SDSM.
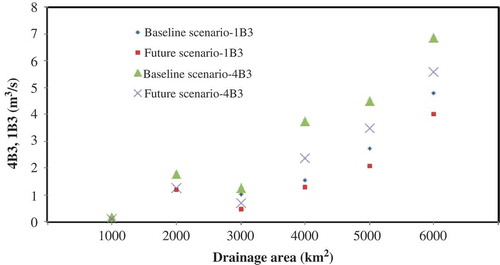
Figure 11. Percentage difference in 4B3 and 1B3 between the baseline and future hydraulic fracking scenarios using the 30-year climate dataset generated by the SDSM. The dotted line represents the trend in 4B3 and solid line represents the trend in 1B3.
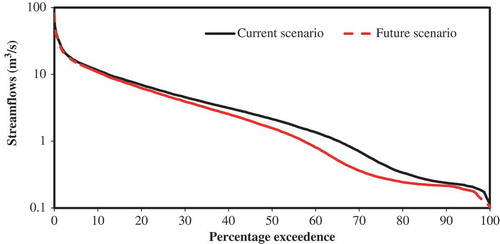
Figure 12. Flow duration curve for the current and future hydraulic fracking scenarios using the 30-year climate dataset generated by the SDSM in the Muskingum watershed.