Figures & data
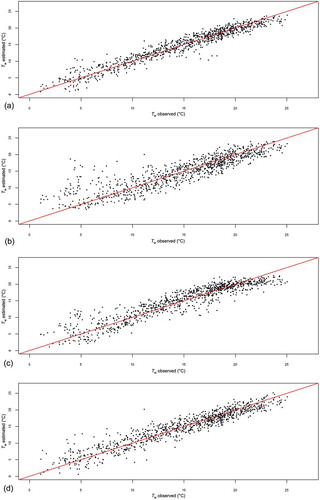
Figure 1. Sainte-Marguerite River drainage basin with locations of hydrometric station, weather station and thermographs (S1, S2, S3).
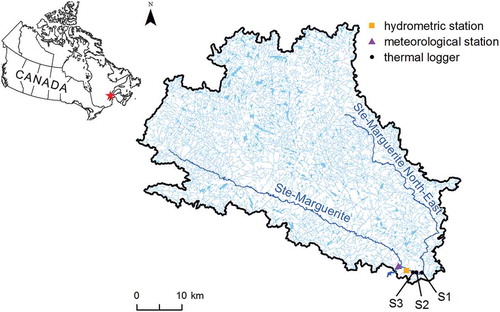
Table 1. Number of concomitant records by year for the three variables: water temperature, air temperature and flow.
Figure 2. (a) Average daily water and air temperatures from 2005 to 2015; and (b) average daily flows from 2005 to 2015.
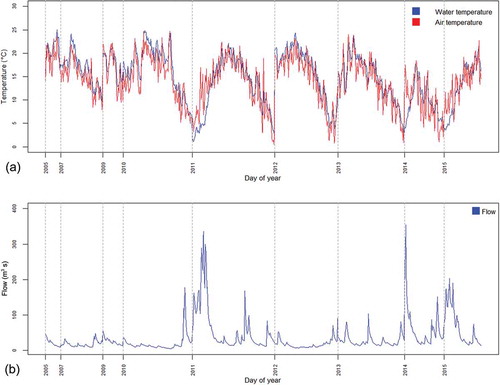
Table 2. Significance of effects.
Figure 3. Estimated smoothing functions representing the contributions of predictors: (a) air temperature; (b) flow; and (c) day of year.
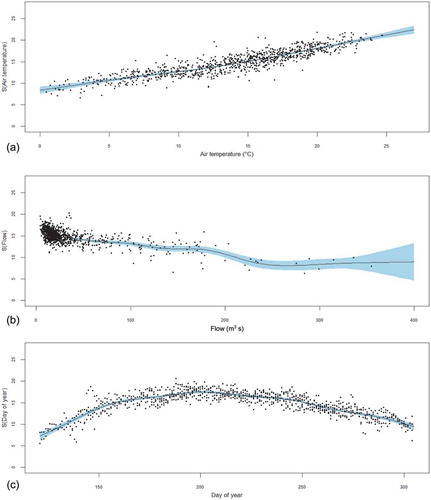
Figure 4. Normal Q-Q plot of GAM residuals.
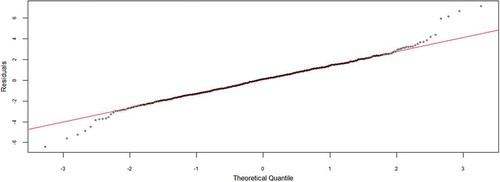
Figure 5. Normal distribution of GAM residuals.
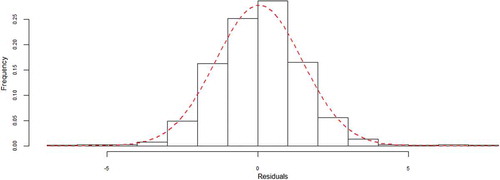
Figure 6. Residuals versus estimated water temperatures.
Figure 7. Relationship between daily mean water temperature and mean air temperature and a fitted logistic function.
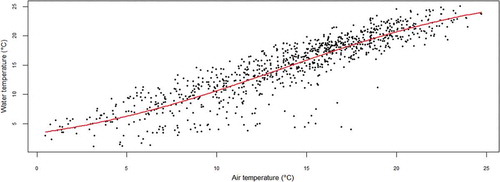
Figure 8. Mean daily water temperature, annual component estimated by sinusoidal function and the residual component.
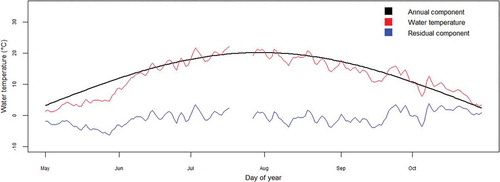
Table 3. Results of the cross-validation of water temperature (°C) modelling expressed by RMSE, bias error and NSC by the GAM, logistic, residuals regression and linear regression approaches.
Figure 9. Scatterplot of observed versus predicted values for (a) the GAM model; (b) the logistic model; (c) the residuals regression model; and (d) the linear regression model for the season of May–October (2005–2015).