
Figures & data
Figure 1. Map of the study zone and the associated geological characteristics, based on geological map 3369-I, Aconcagua (SEGEMAR Citation2014). 1: El Salto North Stream; 2: El Salto South Stream; 4: El Salto Stream; 5: Potrerillos precipitation; 6: Mendoza River in Guido; 7: Frontal groundwater spring; 8: Alumbre Stream; 9: Uspallata Stream; 10: Tambillos Stream; 11: San Alberto Stream; 12: Mendoza River; 13: Chacay Stream; 14: Ranchillo Stream; 15: Picheuta Stream; 16: Cortaderas Stream; 17: Tambillos Stream; 18: Polvaredas Stream; 19: Polvaredas precipitation; 20: Polvareditas Stream; 21: Negro Stream; 22: Colorado River; 23: Mendoza River; 24: Vacas River; 24: Cuevas River; 25: Relincho debris-covered and rock glacier; 26: Tupungato River; 28: Valle Azul snow catchment; 29: Santa María Stream; 30: Los Puquios snow catchment; 31: Cementerio Stream; 32: Cuevas River in Puente del Inca; 33: Puente del Inca precipitation; 34: Horcones River; 35: Horcones precipitation; 36: Almacenes rock glacier; 37: Horcones River in Durazno Ravine; 38: Horcones Inferior debris-covered glacier; 39: Horcones Superior Glacier; 40: Cascada Blanca Spring; 41: La Salada Spring; 42: unnamed spring (near Vertiente del Inca); 43: Tolosa Rock Glacier; 44: sample U5; 45: Cuevas River in Las Cuevas village; 46: Cuevas River in Matienzo Ravine; 47: Bonete Stream; 48: Matienzo debris-covered and rock glacier; 49: Alma Blanca Glacier; 50: Piloto Glacier.
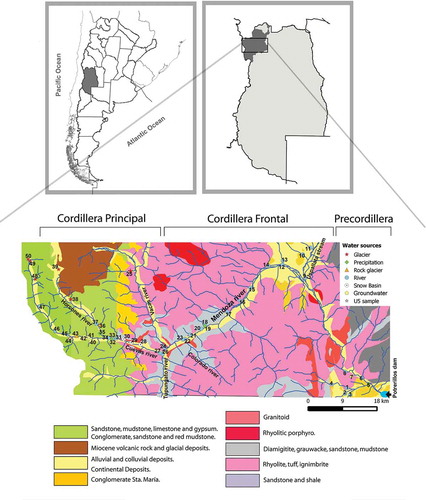
Table 1. Sampling design. Mix. Ppal-Ftal: samples taken in the Mendoza River where it receives water from both the Cordillera Principal and the Cordillera Frontal. Gl: uncovered glacier; DebCov: debris-covered glacier; Rock gl: rock glacier; Cov&Rock gl: crioform composed of both debris-covered and rock glacier. This classification is according to IANIGLA-ING (Citation2012a).
Figure 2. Boxplots of the major ions, pH and electrical conductivity for each season in the Cordillera Principal rivers.
Figure 3. Boxplots of the major ions, pH and electrical conductivity for each season in the Cordillera Frontal rivers.
Figure 4. Piper diagram showing differences in ionic composition between samples from the different geological provinces. Chemical compositions of surface and groundwater in the Upper Mendoza River basin vary from calcium sulphate type in the Cordillera Principal to calcium-magnesium bicarbonate type in the Cordillera Frontal and Precordillera.
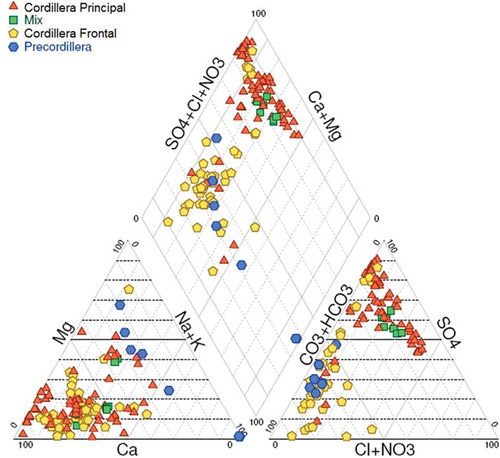
Figure 5. Plots of (a) Ca2++Mg2+ and SO42-+HCO3−, (b) Na+ and Cl−, (c) Ca2+ and SO42− and (d) Ca2+ and HCO3−, explaining the dissolution processes. The lines represent the 1:1 relationship.
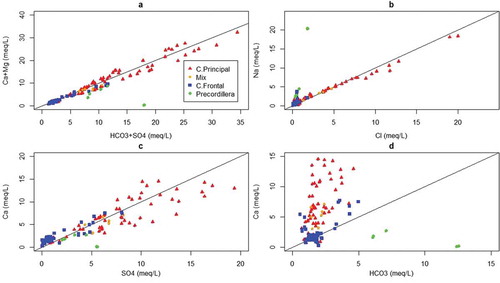
Figure 6. Boxplots of δ18O for the waters draining each geological province and the waters of a mixture coming from the Cordillera Principal and the Cordillera Frontal (Principal-Frontal). δ2H shows the same response.
Figure 7. Boxplots of δ18O, δ2H and deuterium excess for the rivers from the Upper Mendoza River basin and the δ18O signature for the Cordillera Principal, Cordillera Frontal and the mix of water from both geological provinces, represented in each season.
Figure 8. Scatterplot of stable isotope values for all the samples analysed. The grey line represents the LMWL obtained from Hoke et al. (Citation2013) data and our precipitation samples (δ2H = 8.29 δ18O + 13.13, R2 = 0.99). The black line shows the global meteoric water line (Craig Citation1961).
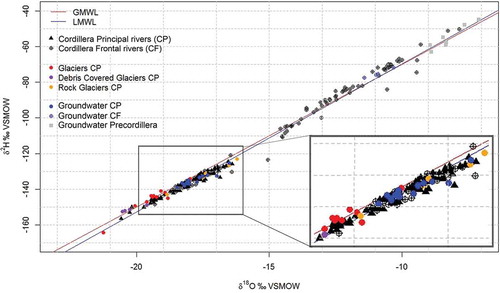
Figure 9. Boxplot of δ18O for the different water sources analysed in the Cordillera Principal. gl: uncovered glacier; glCov: debris-covered glacier; Rgl: rock glacier; and glCov&Rgl: crioform composed of both debris-covered and rock glacier.
Figure 10. PCA plots for (a) the Upper Mendoza River basin and (b) the Cordillera Principal geological province. The main variables affecting the two leading dimensions of the principal components analysis are EC and δ18O.
Figure 11. Temporal evolution of stream waters and positions of the different water sources along the principal component axes (PC) for the main streams and sources in the Cordillera Principal. (a) Cuevas River in Puente del Inca, (b) La Salada Spring, (c) Horcones River, (d) Vertiente del Inca Spring, (e) Tupungato River in Punta de Vacas, (f) Tolosa Rock Glacier, (g) Cuevas River in Punta de Vacas, (h) Vacas River in Punta de Vacas, (i) Cuevas River near the Matienzo Valley, (j) Santa María Stream, (k) Valle Azul Stream*, (o) Los Puquios Stream, (p) Horcones Inferior debris-covered glacier, (q) Horcones Superior uncovered glacier, (r) unnamed spring (near Vertiente del Inca), and (u) temporal spring in Las Cuevas. Water samples collected in different seasons, beginning in summer 2011, continuing in autumn, winter, spring and summer 2012 are marked as 1, 2, 3, 4 and 5, respectively, after the identification character. Each line points in the direction of time, starting in summer 2011 and ending in summer 2012. Triangles and squares: groundwater; blue stars: uncovered and debris-covered glaciers; brown stars: rock glaciers. * snow-derived stream, only active in spring.
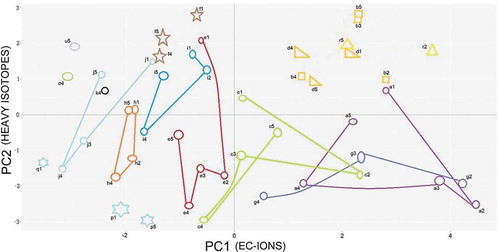
Table 2. Mean (x), standard deviation (SD) and confidence range (CR) relative to the intercept value of geological provinces and season, in comparison with the intercept (Cordillera Principal and summer). The significance of statistical tests illustrates the differences between the electrical conductivity (EC) of water derived from the Cordillera Principal and the Cordillera Frontal, and between the summer and other seasons. Mix. Ppal-Ftal: samples taken in the Mendoza River where it has a mixture of waters coming from the Cordillera Principal and the Cordillera Frontal. The significance factors are: p < 0.001 (***), 0.01 (**), 0.05 (*) and 0.1 (.).
Table 3. Mean (x), standard deviation (SD) and confidence range (CR) relative to the intercept value of water source and season in the Cordillera Principal, in comparison with the intercept (uncovered glacier and summer). The significance of statistical tests illustrates the differences between EC from uncovered glaciers in contrast with the other water sources, and between the summer (intercept) and the other seasons. Refer to for significance factor explanation.
Table 4. Akaike weights (wi), according to the number of parameters and ΔAICc from the different models. GP: geological province; S: season.
Table 5. Mean (x), standard deviation (SD) and confidence range (CR) relative to the intercept value of geological provinces and season in comparison with the intercept (Cordillera Principal and summer). The significance of statistical tests illustrates the differences between the δ18O signatures from water derived from the Cordillera Principal (intercept) in contrast with waters from the Cordillera Frontal and Precordillera, and between the summer (intercept) and the other seasons, for n = 229 observations. Mix. Ppal-Ftal: samples taken in the Mendoza River where it has a mixture of waters coming from the Cordillera Principal and the Cordillera Frontal. Refer to for significance factor explanation.
Table 6. Akaike weights (wi) according to the number of parameters and ΔAICc from the different models, using as fixed-effect factors the variables water source (source), season and altitude, for the Cordillera Principal geological province.
Table 7. Akaike weights (wi), according to the number of parameters and ΔAICc from the different models, using as fixed-effect factor the variables water source (source) and season, for the Cordillera Principal geological province.
Table 8. Mean (x), standard deviation (SD) and confidence range (CR), relative to the intercept value, of water sources and seasons in comparison with the intercept (uncovered glacier and summer). The significance of statistical tests illustrates the differences between the δ18O signatures from uncovered glaciers (intercept) and the other water sources, and between the summer (intercept) and the other seasons, for 125 observations in the Cordillera Principal geological province. Refer to for significance factor explanation.
Table 9. Mean (x), standard deviation (SD) and confidence range (CR) relative to the intercept value of water source and season in comparison with the intercept (uncovered glacier and summer). The significance of statistical tests illustrates the differences between the deuterium excess values from uncovered glaciers (intercept) and the other water sources, and between the summer (intercept) and the other seasons, for 125 observations in the Cordillera Principal geological province. Refer to for significance factor explanation.
Table 10. Akaike weights (wi) according to the number of parameters and ΔAICc from the different models. GP: geological province.
Table 11. Mean (x), standard deviation (SD) and significance of geological province, season and altitude fixed-effect factors in comparison with the intercept (Cordillera Principal and summer). The significance of statistical tests illustrates the differences between the δ18O signatures of water derived from the Cordillera Principal (intercept) and the Cordillera Frontal geological provinces and between the summer (intercept) and the other seasons. Mix. Ppal-Ftal: samples taken in the Mendoza River where it has a mixture of waters coming from the Cordillera Principal and the Cordillera Frontal. Refer to for significance factor explanation.