
Figures & data
Figure 1. Broome coastal sub-catchments and Roebuck Bay.
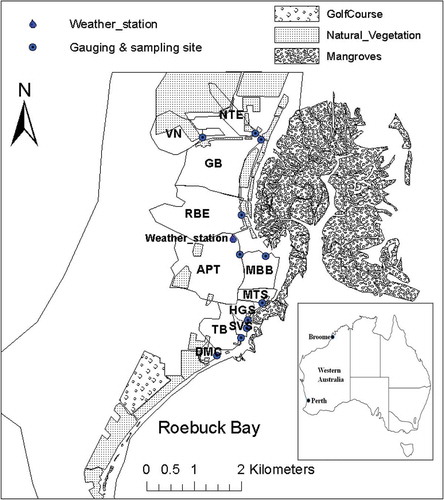
Figure 2. (a) Mean monthly rainfall and mean number of days of rain ≥10 mm in Broome for the periods 1939–2012 and December 2011–March 2012 (BOM Citation2013). Grey areas show the 2011/12 wet season (study period), which spans from January to March. (b) Rainfall, rainfall intensity and antecedent dry period. (c) Calculated runoff volume from sub-catchments for the 2011/12 wet season.
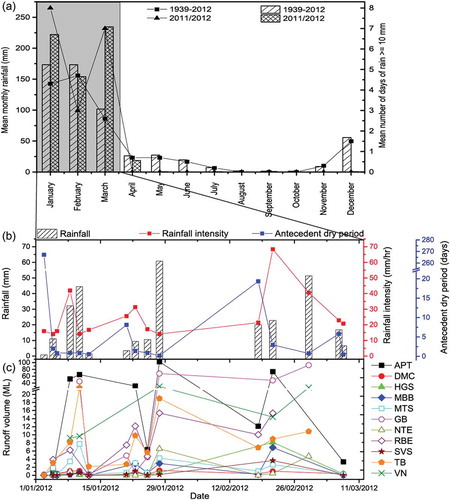
Table 1. Characteristics of urbanizing sub-catchments in Broome town.
Figure 3. Relationships between runoff, impervious percentage and rainfall intensity.
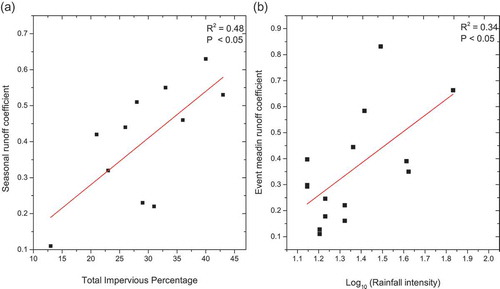
Figure 4. (a) Temporal variation of EMCs of TN, N-NH4+, N-NOx−, TP and P-PO43− for the 2011/12 wet season from the 11 sub-catchments. (b) SMFF ratios for TN, NH4+, N-NOx−, TP and P-PO43− against cumulative runoff volume for the study period for all sub-catchments. In (b), the dashed line at 1.0 represents the SMFF where the nutrient loadings are uniform throughout the wet season (i.e. no seasonal first flush). Values >1 indicate the seasonal first flush during the early part of the wet season.
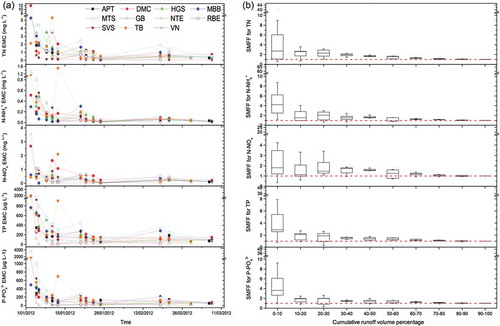
Figure 5. Bi-plot for the first two principal components with nutrient, catchment and hydrological variables and their correlations with sub-catchments.
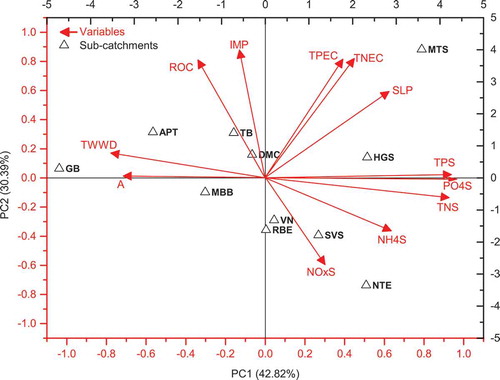
Figure 6. Nutrient export coefficients from Broome coastal sub-catchments.
Table 2. Typical/median nutrient export coefficients for different catchments in different climate conditions (Beaulac and Reckhow Citation1982, Young et al. Citation1996, Taylor et al. Citation2005).
Figure 7. Hydrographs and pollutographs for representative sub-catchments from Old Broome Town (MTS) and Broome North (GB). Runoff volumes were converted to runoff depths in mm and nutrient concentrations were normalized by dividing a particular nutrient concentration at a time by the initial nutrient concentration at the start of the wet season. Time was normalized as 1 represents 180 min.
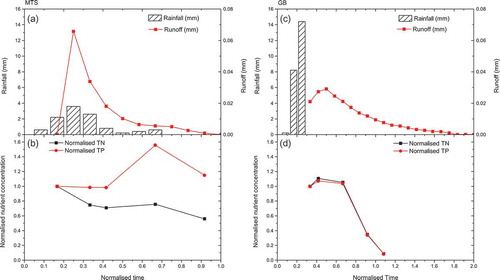
Figure 8. Framework for managing storm-water nutrients from an ungauged, remote, subtropical catchment.
Figure B1. Cumulative nutrient loading percentage curves for (a) TN, (b) NH4+, (c) N-NOx−, (d) TP and (e) P-PO43− against cumulative runoff volume percentages in the 11 sub-catchments. A seasonal first flush occurs if the data ascend above the dashed line, which represents uniform nutrient loading throughout the wet season.
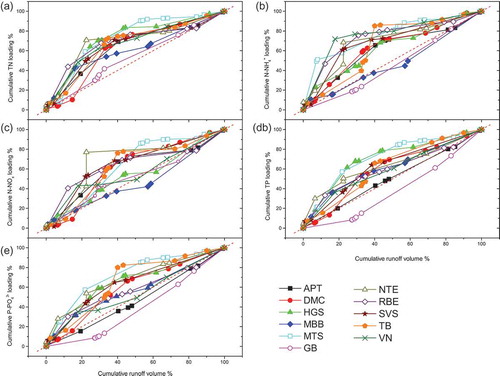
Table A1. Manning’s n values for Broome drains in each sub-catchment. Values were compiled from the literature (French Citation1986, Streeter et al. Citation1987, FHWA Citation2011) and selected following the guide by Arcement and Schneider (Citation1989).
Table C1. Correlation matrix for the parameters presented in the PCA bi-plot. Bold indicates significant values (except diagonal) at the level of significance α = 0.050 (two-tailed test).