Figures & data
Table 1. Catchment characteristics.
Figure 1. Location of the Rheraya catchment.
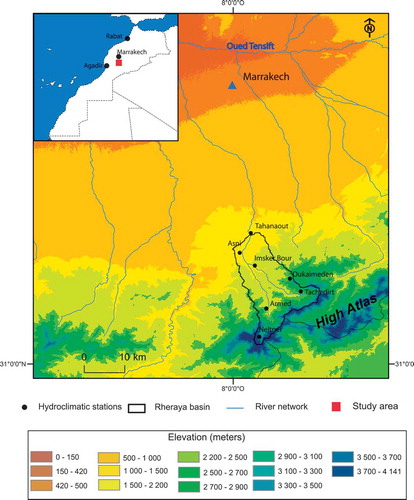
Figure 2. Mean inter-annual (a) daily precipitation, (b) temperature and (c) runoff for the Rheraya catchment.
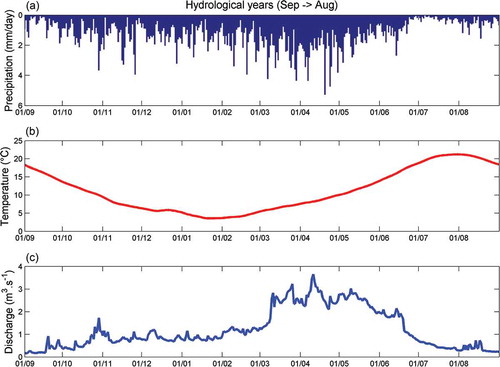
Table 2. Med-CORDEX simulations available at 50 km resolution (MED 44 grid). GUF: Goethe University Frankfurt; IPSL:Institut Pierre Simon Laplace; CNRM: Centre National de Recherches Météorologiques; ICTP: International Centre for Theoretical Physics; CMCC: Centro Euro-Mediterraneo sui Cambiamenti Climatici.
Figure 3. Correlation between PET computed using the Oudin, Hargreaves-Samani and Penman-Monteith formulas.
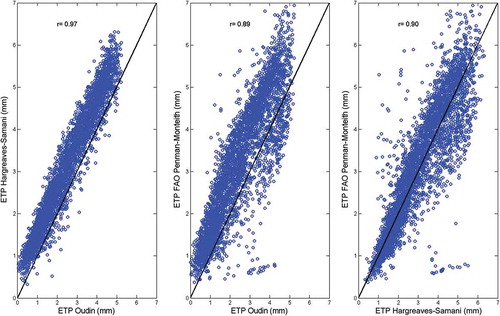
Figure 4. Observed and RCM temperatures during the reference period 1989–2005.
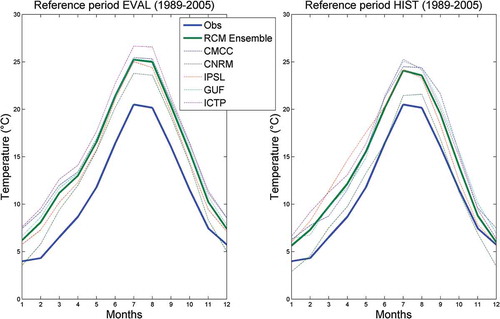
Figure 5. Observed and RCM precipitation during the reference period 1989–2005.
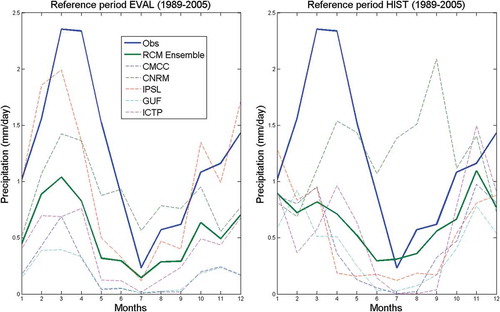
Table 3. The precipitation change signal (%) between 1989–2005 and 2049–2065 for each climate model and scenario.
Figure 6. Projected precipitation for the future period 2049–2065.
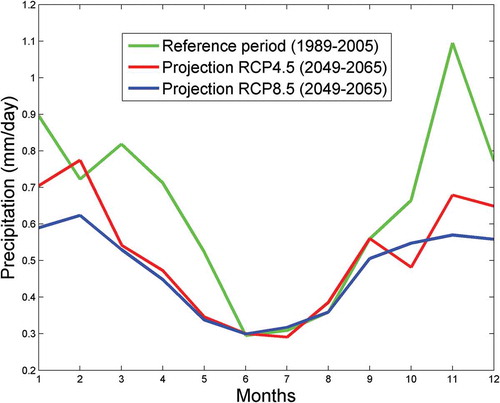
Table 4. The temperature change signal (°C) between 1989–2005 and 2049–2065 for each climate model and scenario.
Figure 7. Projected temperature for the future period 2049–2065.
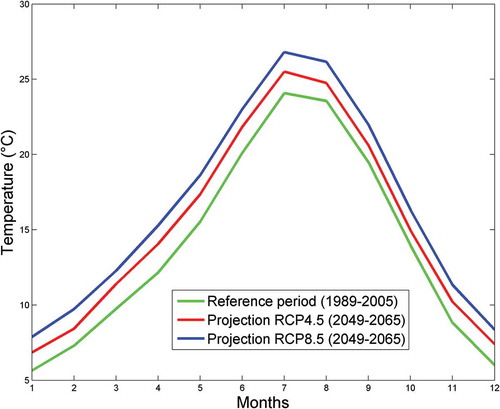
Table 5. Calibration and validation results of the MWBM.
Table 6. Calibration and validation results of GR2M.
Figure 8. Observed and simulated mean runoff cycles for the reference period 1989–2009, according to different sets of calibrated parameters for the GR2M and MWBM.
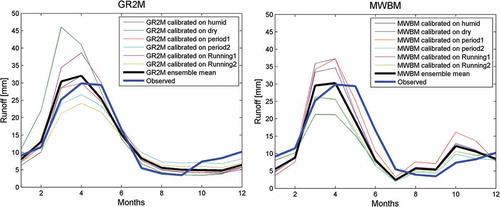
Figure 9. Comparison of the projected changes in runoff with delta-change and quantile-perturbation methods.
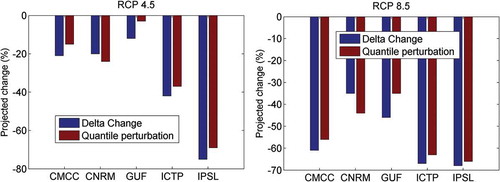
Figure 10. Projected changes in runoff from five RCM simulations for the future period 2049–2065.
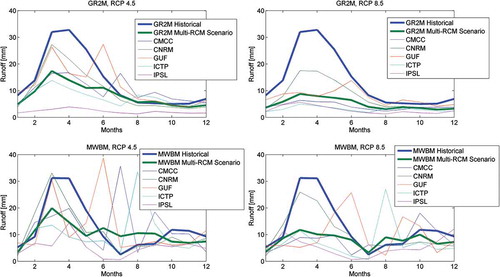
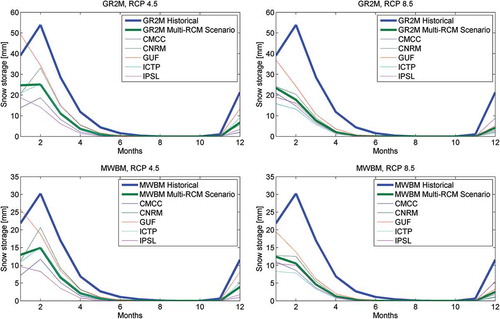
Figure 11. Projected changes in snow reservoir levels from five RCM simulations for the future period 2049–2065.