Figures & data
Table 1. Time intervals used in the simulation of the theoretical loam soil.
Figure 1. Diagram of the experimental set-up.
Table 2. Soil properties of the studied soils, applied pressures, evaporation rates and experimental times used in the upward infiltration overpressure step and evaporation processes.
Figure 2. Contours of the objective function Φ(K,α,n) for the upward infiltration curves in the (a) K–n, (b) α–n and (c) K–α planes, without (1) and with (2) an overpressure step of 5 cm at the end of the wetting process. The number of contour lines corresponds to a 70 × 70 parameter combination grid. The thick (red) line indicates the experimental contour line corresponding to a RMSE of 0.1 mm due to water level measurement.
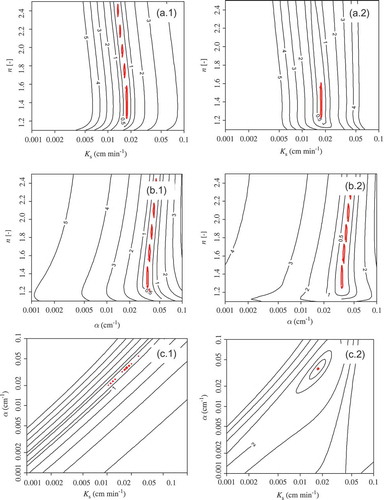
Figure 3. Contours of the objective function Φ(K,α,n) for an evaporation process: one parameter is fixed and the other two are optimized in the (a) K–n, (b) α–n and (c) K–α planes. See caption for details.
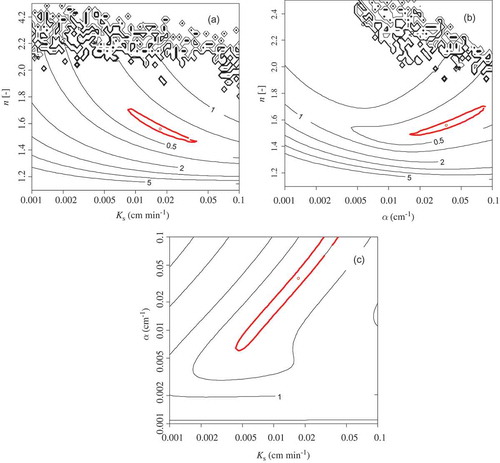
Figure 4. Contours of the objective function Φ(K,α,n) for the upward infiltration curves plus the cumulative evaporation curves: one parameter is fixed and the other two are optimized in the (a) K–n, (b) α–n and (c) K–α planes, without (a) and with (b) an overpressure step of 5 cm at the end of the wetting process. See caption for details.
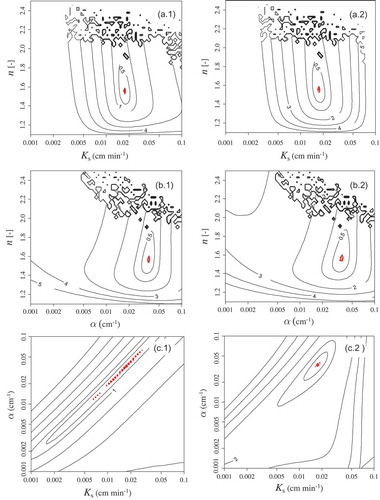
Table 3. Soil bulk density (ρb), saturated (θs) and residual water contents (θr), saturated hydraulic conductivity (Ks), the n and α parameters of the van Genuchten (Citation1980) water retention curve estimated for a wetting (αw) and a draining process (αd) from the TDR-pressure cell (PC) and the inverse analysis (CR-E), respectively, measured on sand and 2-mm sieved loam and clay-loam soils. The α values in italics were calculated according to the Gebrenegus and Ghezzehei (Citation2011) model. W & D: wetting and drying.
Figure 5. (a) Contours of the objective function Φ(K,α,n) for the cumulative upward infiltration plus the cumulative evaporation curves: one parameter is fixed and the other two are optimized in the α–n plane for a 2-mm sieved loam soil. See caption for details. (b) Experimental (circles) and optimized simulated (line) cumulative upward infiltration plus evaporation curves measured on a 2-mm sieved loam. (WCR: water capillary rise.)
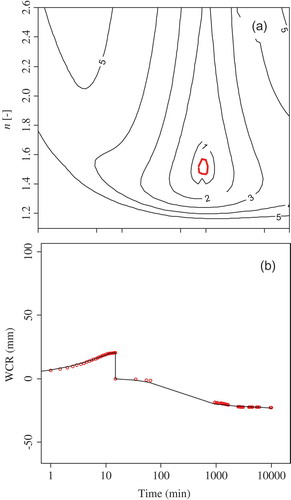
Figure 6. Comparison between effective saturation (Se) curves measured in (a) fine sand, (b) sieved loam and (c) sieved clay-loam soil with TDR pressure cells (circles) during a draining process and the corresponding curve obtained by inverse analysis (line) of the cumulative upward infiltration–evaporation curve in the draining branch of the water retention curve.