Figures & data
Figure 1. Location of the studied site (K-puszta) in the Great Hungarian Plain (GHP) in east Hungary. The meteorological data were taken from Kecskemét, which is located ~8 km to the southeast from K-puszta. On the map, Debrecen is also shown, from where relatively long-term stable isotope measurements of precipitation have been published (Vodila et al. Citation2011).
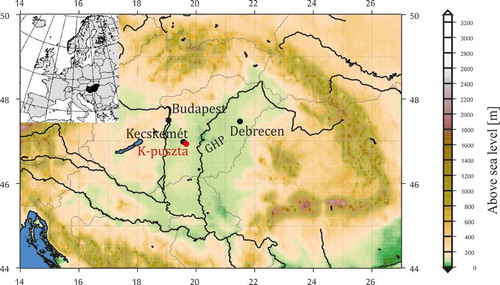
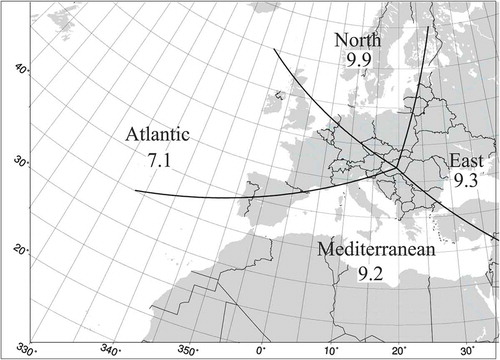
Figure 2. The sectors for determination of precipitation sources of K-puszta.
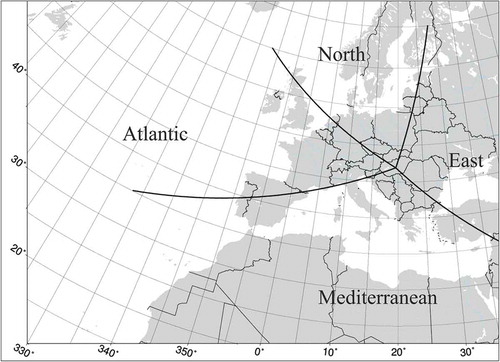
Figure 3. (a) Monthly mean temperature (blue) for the study period (April 2012–March 2013) and the differences (red) relative to the long-term average of monthly mean temperature (1981–2010). (b) Monthly amount of precipitation (blue) for the study period (April 2012–March 2013) and the differences (red) relative to the long-term average of monthly precipitation (1981–2010).
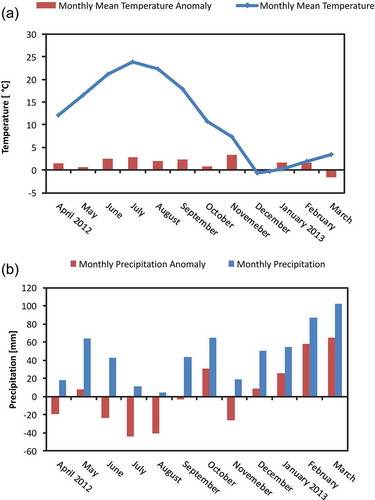
Figure 4. Backward trajectories representing the days with precipitation in the period April 2012–March 2013. The source regions are shown: Mediterranean (red), Atlantic (green), Northern European (blue) and Eastern European (brown).
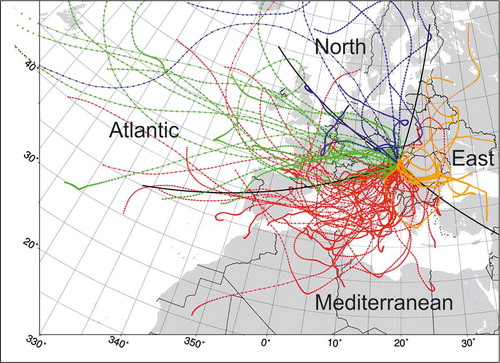
Figure 5. (a) Distribution of moisture sources based on the number of precipitation events; (b) calculated d-excess of different moisture sources; and (c) distribution of moisture sources based on the amount of the precipitation in different moisture sources.
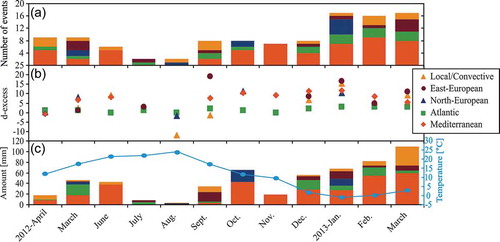
Figure 6. Variation of the stable isotope composition (δD and δ18O) of daily precipitation during the study period.
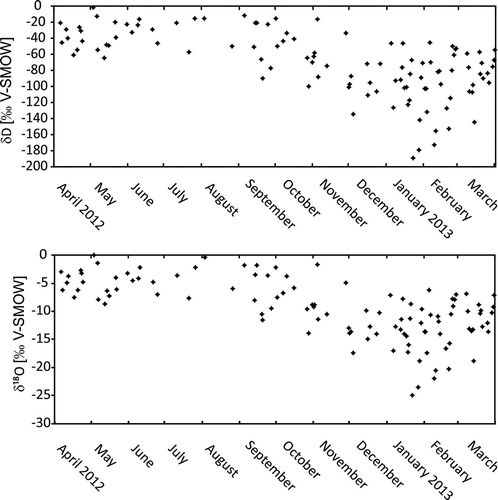
Figure 7. Amount-weighted stable isotope composition of monthly precipitation in K-puszta with the local meteoric water line (LMWL). The global meteoric water line (GMWL, Craig Citation1961) is also shown.
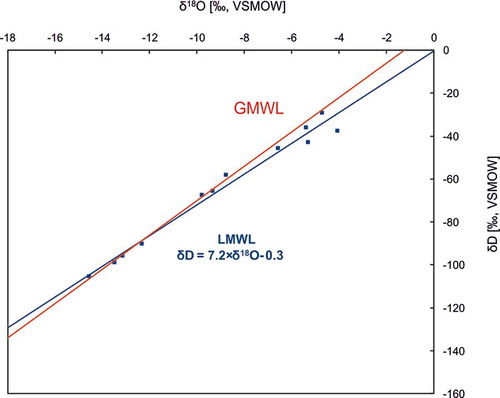
Figure 8. Calculated amount-weighted d-excess for each sector based on the determination of moisture source of daily precipitation.