Figures & data
Table 1. Average stable isotopic composition and d-excess values of water by type in the cool temperate region.
Table 2. Seasonal oxygen-18, deuterium, d-excess values, and seasonal local meteoric water line (LMWL) showing δ18O–δD relationship of various precipitation types.
Figure 1. Map of Korean peninsula (a) showing sampling locations (b) and (c). Inset shows the plan of sample collection at each site. Each point shows the placement of the three throughfall apparatuses used for sample collection at each site.
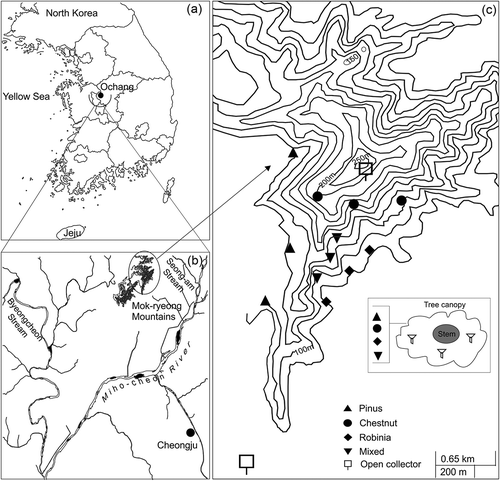
Figure 2. Oxygen (δ18O) and deuterium (δD) isotopic compositions and d-excess values (‰) (primary y-axis) of rainfall (●) (a), and red pine (□), black locust (○), chestnut (×) and mixed stand (∆) throughfall events (b) collected in cool temperate forests, South Korea. Secondary y-axis shows the amount of rainfall and throughfall (mm). Horizontal dashed lines show weighted-average isotopic values. Shaded area shows snowfall samples.
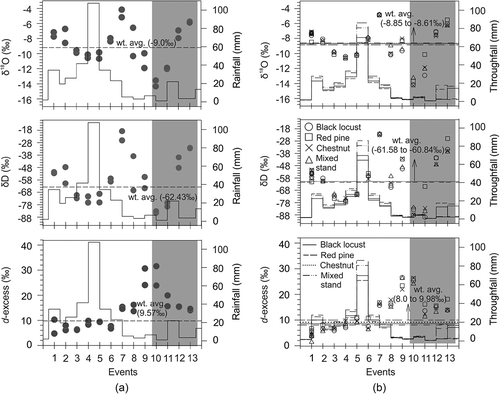
Figure 3. Differences in δ18O isotopic composition between throughfall (δ18OTh) and rainfall (δ18ORf) (primary y-axis; black closed columns) and throughfall amount recorded during events (secondary y-axis, downward grey columns) in (a) red pine, (b) mixed stand, (c) chestnut and (d) black locust stands. The values above the x-axis (upward black columns) indicate throughfall enriched compared to rainfall and those below the x-axis (downward black columns) indicate throughfall less enriched compared to rainfall. Shaded area shows snowfall samples.
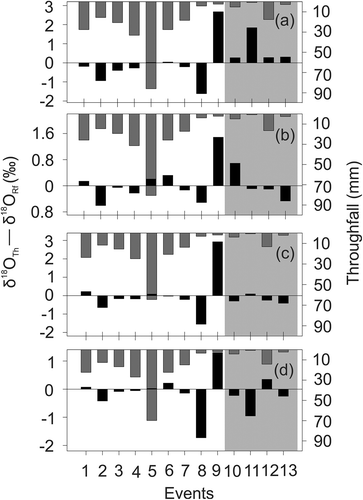
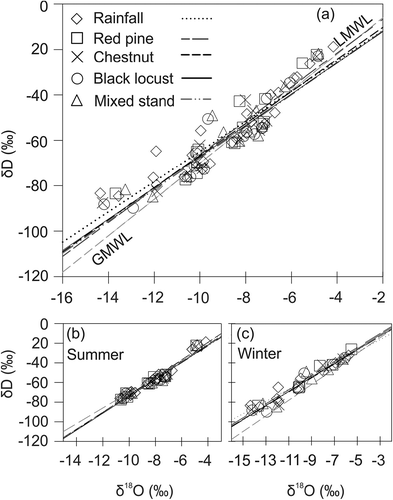
Figure 4. Covariation plots of δD–δ18O of all (a) and seasonal (b) and (c) precipitation samples collected in the study from cool temperate forests, South Korea. Global meteoric water line (GMWL) (grey dashed line) with δD = (8 × δ18O) + 10 (Craig Citation1961) is plotted for reference. Local meteoric water line (LMWL) is based on the sample collected in the study.