
Figures & data
Figure 1. Tarland catchment: (a) location; (b) topography; and (c) land use.
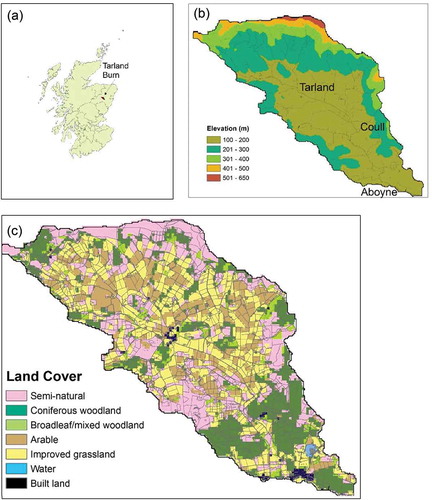
Table 1. Modified soil saturated hydraulic conductivity (Ks) based on land-use type.
Table 2. Land-use change scenarios (% area of each land use).
Figure 2. Land-use scenario descriptions (after Brown and Castellazzi Citation2014).
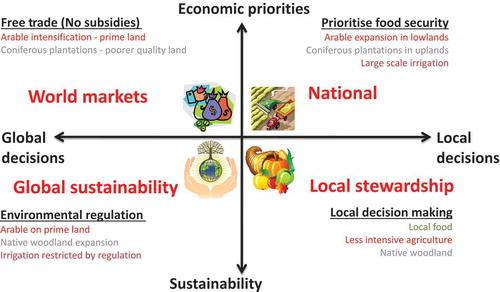
Table 3. Model calibration data.
Table 4. Changes for 10- and 100-year return period events for Tarland Burn catchment (% differences from baseline in parentheses): (a) precipitation (mm); (b) peak flow (m3 s−1) at Coull.
Table 5. Peak flows (m3 s−1) for afforestation options and UKCP09 WG climate change scenarios (mean ensemble value medium emissions). con: coniferous; dec: deciduous.
Figure 3. Illustrative land-use scenarios for Tarland catchment in 2050 (after Brown and Castellazzi Citation2014).
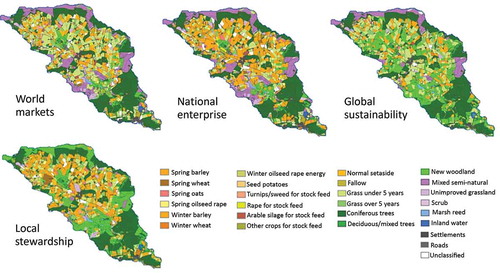
Figure 4. Change (%) in Q5 and Q95 at Coull for different catchment afforestation extents. Legend: con: coniferous; dec: deciduous; aff: afforestation.
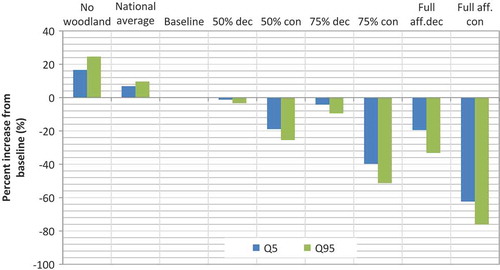
Figure 5. Changes in flow duration curves at Coull for different catchment afforestation extent.
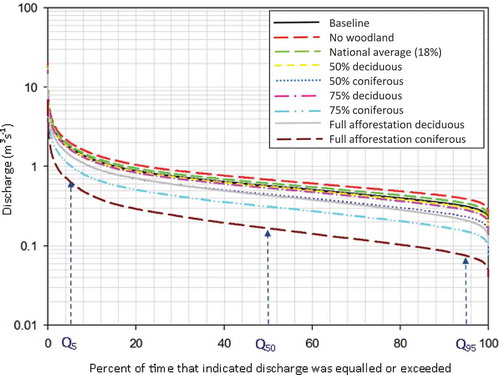
Table 6. Change in 2050s peak flows at Coull for land-use change scenarios and climate change projections (UKCP09 medium emissions) for the 2050s compared to no land-use change. WM: world markets; NE: national enterprise; GS: global sustainability; LS: local stewardship.