Figures & data
Table 1. Land use and soil types for the study watersheds.
Figure 1. Locations and boundaries of the study watersheds on Prince Edward Island, Canada.
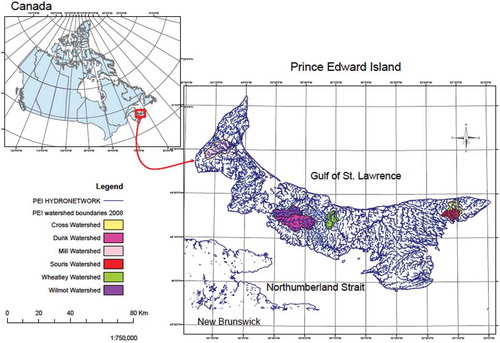
Table 2. Meteorological and hydrometric stations used in this study.
Figure 2. Architecture of an ANFIS model (adapted from Jang Citation1993).
Table 3. Values of parameters for all rivers in the equation: SSC = a[turbidity]b.
Figure 3. Calibration curve for the Wilmot River.
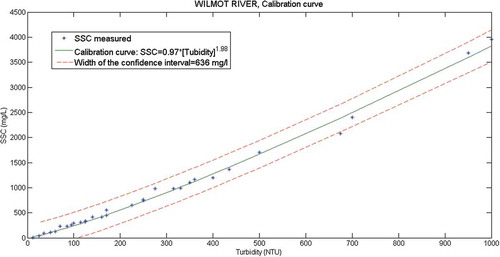
Figure 4. Times series of daily SSC on the six rivers monitored in this study.
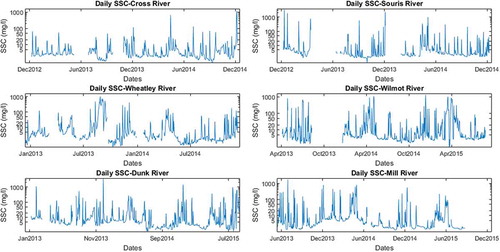
Figure 5. Hydrographs of mean monthly SSC vs watershed vulnerability index.
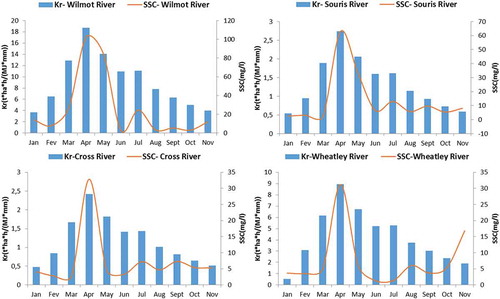
Figure 6. Box plot of watershed vulnerability index for the studied watersheds.
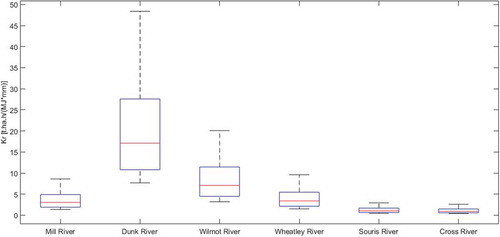
Table 4. Performance of river-specific models using total flow (Qt), precipitation (P), surface runoff (qR), and watershed vulnerability index (Kr).
Figure 7. Scatter plots of observed vs computed SSC (validation phase) for input variables (a) P and Qt, and (b) P, Qt and Kr.
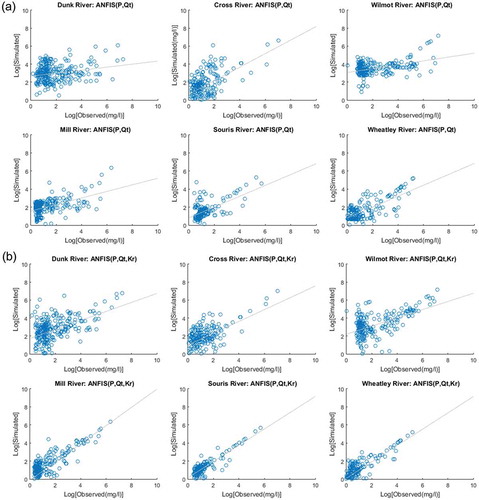
Table 5. Performance of the multi-watershed ANFIS model.
Figure 8. Scatter plots of simulated vs observed SSC for the multi-watershed ANFIS model.
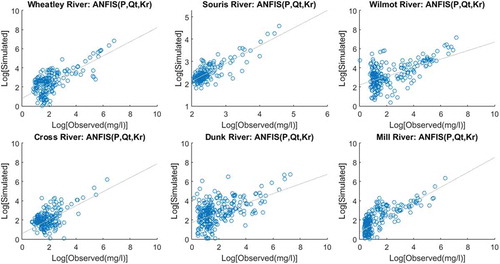
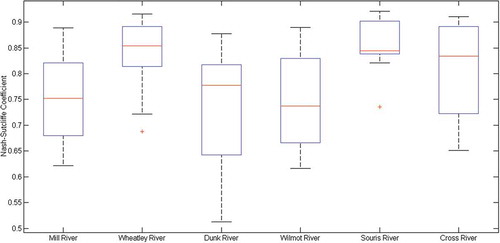
Figure 9. Boxplot of NS coefficient values obtained using 20 different random subsamples of input data to train the multi-watershed ANFIS model.