Figures & data
Figure 1. Study area of India and precipitation zones used in this study.
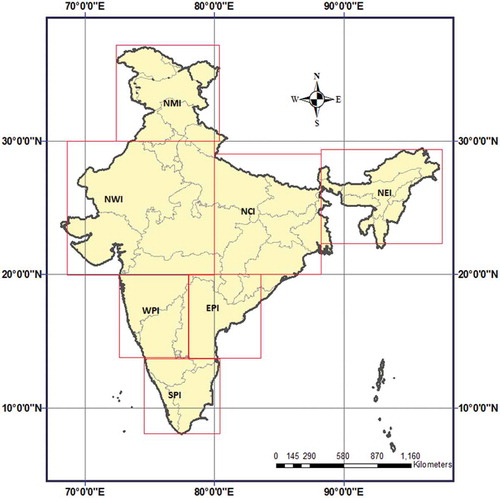
Table 1. Primary statistical parameter values of the precipitation series (1851–2006). SD: standard deviation; CV: coefficient of variation; CS: skewness; CK: kurtosis.
Figure 2. Long-term and short-term linear trends based on annual precipitation series of each zone.
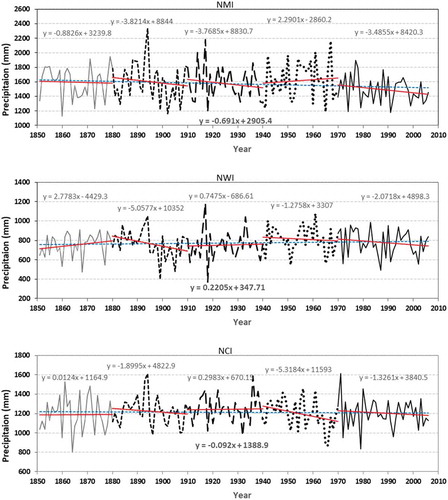
Figure 2. (Continued).
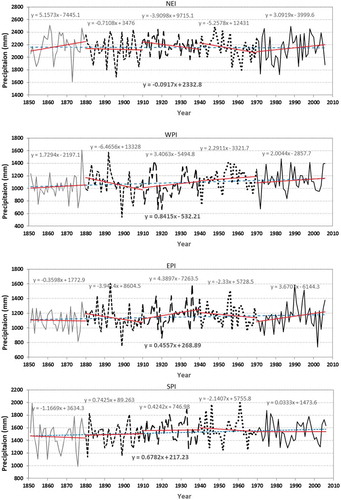
Figure 3. Long-term and short-term linear trends based on monsoon precipitation series of each zone.
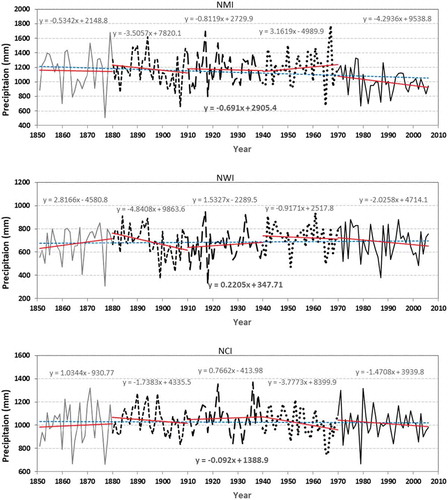
Figure 3. (Continued).
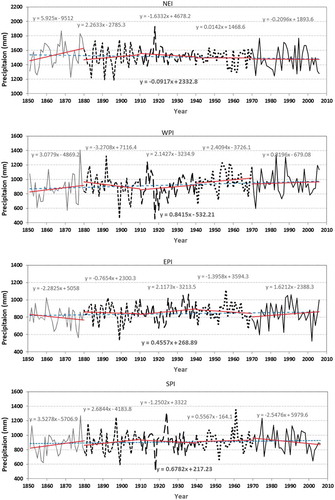
Table 2. Maximum level of decomposition proposed for monthly and yearly series (1851–2006).
Table 3. Mean relative error (MRE) and Z value relative error (Er) at different decomposition levels for All India (AI) monthly series (1851–2006). Bold values indicate the minimum values corresponding to “db”.
Table 4. Mean relative error (MRE) and Z value relative error (Er) at different decomposition levels for AI annual series (1851–2006). Bold values indicate the minimum values corresponding to “db”.
Table 5. MK test (Z value) for original precipitation series (O) and combinations of detailed and approximation series, with coefficient of determination (R2) and NS values. *indicates trend at the 5% significance level, bold indicates the most effective periodic component.
Figure 4. Annual and monsoon SQMK test (Z value) plots for each zone.
Figure 4. (Continued).
Figure 5. Decomposition of original annual precipitation series of All India (AI) into three levels (d1–d3) and approximation (a3).
Figure 6. Decomposition of original monthly precipitation series of AI into six levels (d1–d6) and approximation (a6).
Table 6. MK test (Z value) for monthly series, detail components (D1–D6), approximation (A3) and combinations of detail and approximation. * indicates trend at the 5% significance level, bold indicates the most effective periodic component.
Figure 7. Changes in trend in time for annual original series and combinations of detailed and approximation series.
Figure 8. Changes in trend in time for monsoon original series and combinations of detailed and approximation series.
Figure 9. Changes in trend in time for monthly original series and combinations of detailed and approximation series.
Figure 10. Visualization of detailed component (d1) extreme values of annual precipitation at different threshold values of standard deviation (S) over the WPI zone of India. Red, green and blue lines indicate the threshold values at, respectively, 0.5, 1.0 and 1.5 times the standard deviation of the observed series.
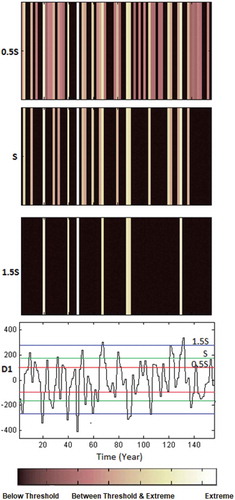
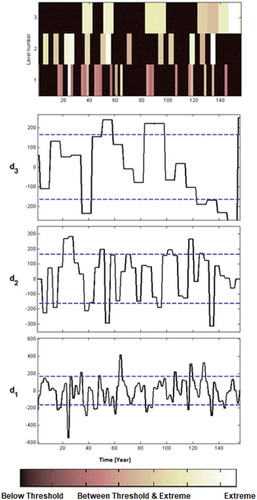
Figure 11. Visualization of extreme values of monsoon precipitation at fixed threshold values over the WPI zone of India. Dashed (blue) lines in d1, d2 and d3 indicate the threshold values (standard deviation of the original series).