Figures & data
Table 1. Four-category skill score matrices used in this study.
Figure 1. Pecatonica watershed map (adopted from Park and Markus Citation2014).
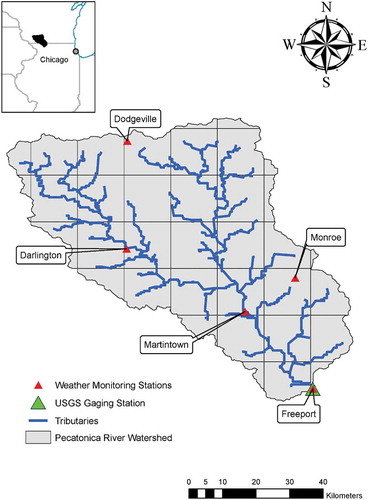
Figure 2. Volumetric percentage of snow and rain contributing to each flood event at Freeport on the Pecatonica River (USGS no. 05435500).
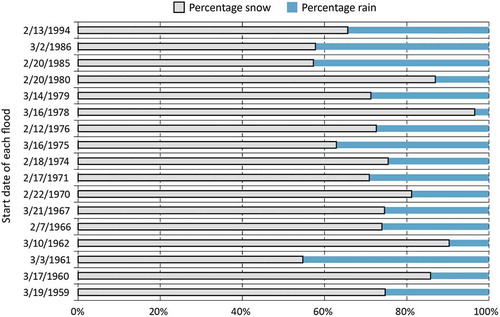
Figure 3. Observed snow depths (colors) at the beginning of each flood event at five climate gages and the corresponding flood peaks (wide boxes with black borders) at Freeport on the Pecatonica River for 17 selected snowmelt-driven floods.
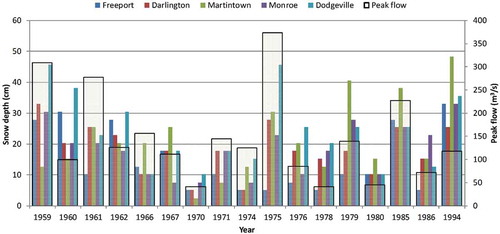
Figure 4. Example of VIC model simulation for a flood in 1975.
Table 2. Range of model parameters used in calibration (modified from Park and Markus Citation2014).
Table 3. Performance metrics of snow depth simulations using the VIC model at five climate stations in 17 snowmelt-dominated flood events between February and March in 1959–1994.
Figure 5. Observed and simulated maximum snow depths for five stations.
Figure 6. Comparisons between observed data and data simulated by VIC: (a) observed flow peaks and observed flow volumes; (b) simulated flow peaks and simulated flow volumes; (c) observed and simulated flow peaks; and (d) observed and simulated flow volumes.
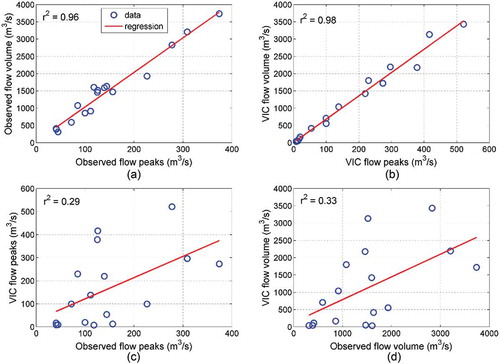
Table 4. Four-by-four contingency tables for snow depth vs flow peaks.
Figure 7. Average over the three skill score methods presented for each gaging station for observed and VIC data between snow depths and flow volumes.
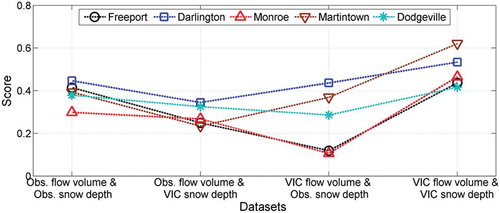
Figure 8. Average over the five stations presented for each skill score method for observed and VIC data between snow depths and flow volumes.
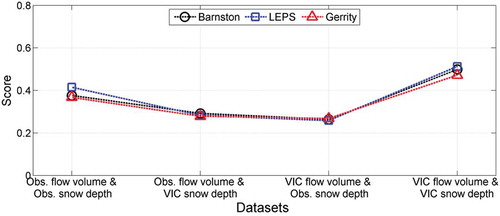
Table 5. Skill scores showing the categorical correspondence between snow depth and flow volume for observed and model-generated data at five gaging stations. Bold numbers denote the highest and second highest scores.
Figure 9. Data-based and model-based averages of the three skill scores between snow depths and flow volumes for early and late periods at Darlington gaging station.
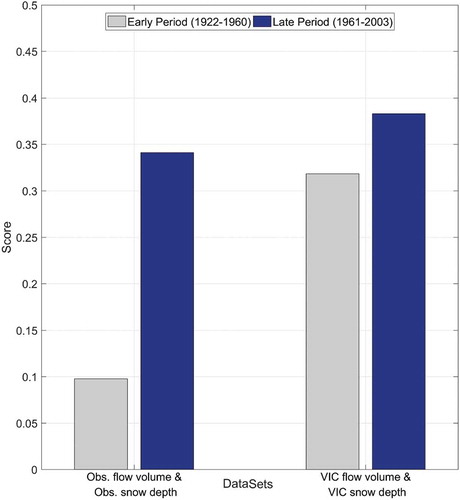
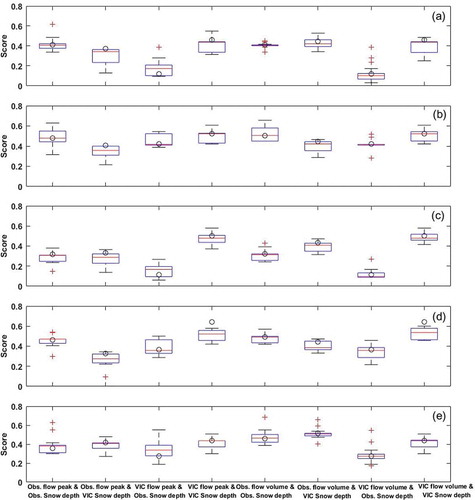
Figure 10. LOOCV box plots of Barnston skill scores depending on stations: (a) Freeport; (b) Darlington; (c) Monroe; (d) Martintown; and (e) Dodgeville. Note that black circles are Barnston skill score results for all 17 year datasets.
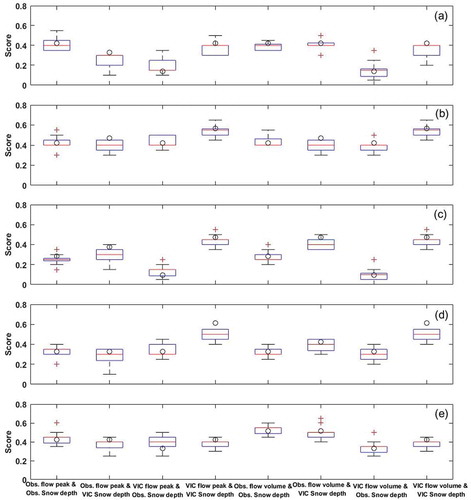
Figure 11. LOOCV box plots of Gerrity skill scores depending on stations: (a) Freeport; (b) Darlington; (c) Monroe; (d) Martintown; and (e) Dodgeville. Note that black circles are Barnston skill score results for all 17 year datasets.
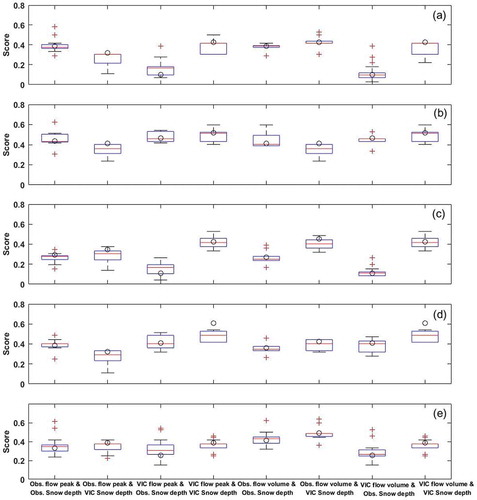
Figure 12. LOOCV box plots of LEPS skill scores depending on stations: (a) Freeport; (b) Darlington; (c) Monroe; (d) Martintown; and (e) Dodgeville. Note that black circles are Barnston skill score results for all 17 year datasets.