
Figures & data
Figure 1. Study area of Godavari River Basin.
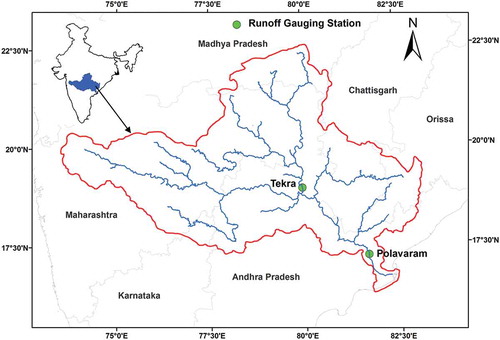
Table 1. List of GCMs used in daily rainfall downscaling.
Figure 2. Flowchart of multiscale downscaling model combined with the VIC hydrological model.
Table 2. Acceptable range and adopted values of the calibration parameters in the VIC-2L model.
Table 3. Model performance indicators for calibration and validation periods for Polavaram station.
Figure 3. Comparison of observed and simulated streamflow: (a) calibration (1976–1990) and (b) validation (1991–2005) periods at Polavaram station.
Figure 4. Observed and GCM-simulated rainfall trends for ISMR averaged over the period 1951–2005: (a) observed IMD, (b) CNRM-CM5, (c) MIROC-ESM, (d) INM-CM4, and (d) NorESM1-M.
Figure 5. Seasonal cycle of monthly ISMR using IMD (observed) and four CMIP5 model simulations (historical), averaged over the period 1951–2005.
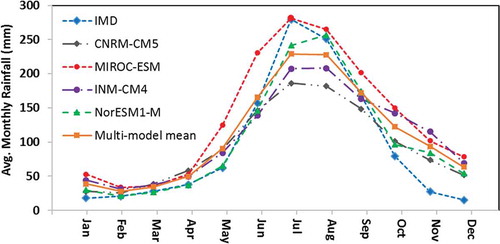
Figure 6. Bias correction applied humidity during monsoon for 1971–2005 over the Godavari River Basin: (a) uncorrected GCM simulations – spatial distribution; (b) NCEP/NCAR reanalysis data – spatial distribution; (c) bias-corrected GCM simulations – spatial distribution; and (d) comparison of different time series of specific humidity.
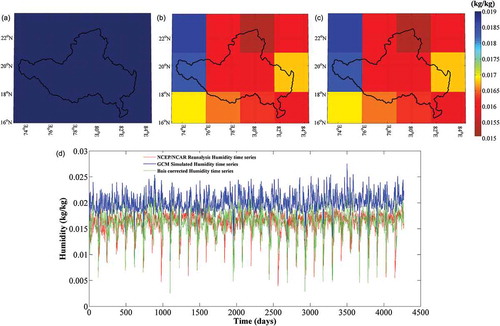
Figure 7. Cumulative percentage of variance explained by NCEP/NCAR principal components (PC) for surface temperature (98% variability), shown with PC number.
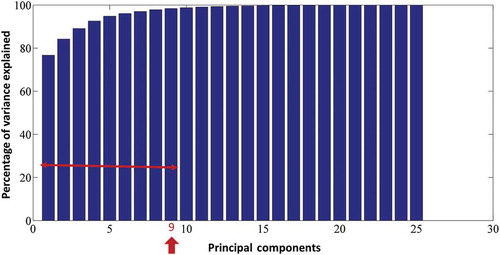
Figure 8. Comparison of means of observed and projected downscaled GCM-simulated monsoon rainfall (CMIP5) for the Godavari River Basin at 0.25° resolution for 1991–2005: (a) IMD (observed rainfall), (b) NCEP/NCAR (projected rainfall), (c) CNRM-CM5, (d) MIROC-ESM, (e) INM-CM4, and (f) NorESM1-M.
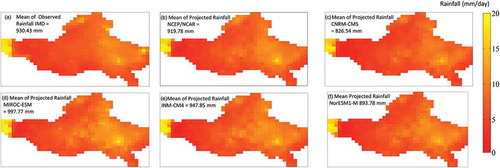
Figure 9. Comparison of standard deviation of observed and projected downscaled GCM-simulated rainfall (CMIP5) for the Godavari River Basin at 0.25° resolution for 1991–2005: (a) IMD (observed rainfall), (b) NCEP/NCAR (projected rainfall), (c) CNRM-CM5, (d) MIROC-ESM, (e) INM-CM4, and (f) NorESM1-M.
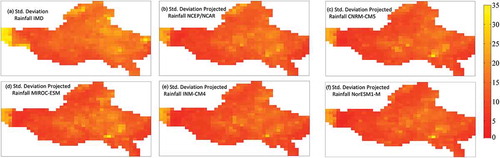
Figure 10. Scatterplots for cross-correlation of multisite rainfall between observed and GCM projected: (a) IMD and NCEP/NCAR, (b) IMD and CNRM-CM5, (c) IMD and MIROC-ESM, (d) IMD and INM-CM4, and (d) IMD and NorESM1-M.
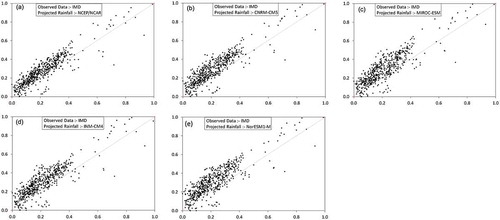
Figure 11. Seasonal cycle of daily ISMR using IMD (observed) and four CMIP5 model projections (historical), averaged over the testing period (1991–2005).
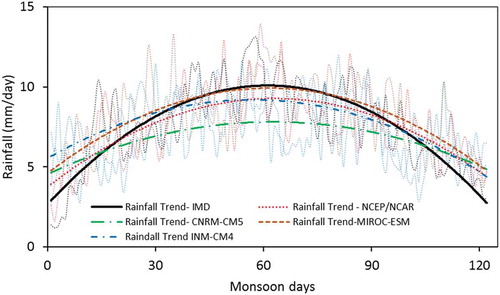
Figure 12. Future projected rainfall using GCM-simulated climate variables and multi-model mean rainfall under the RCP4.5 and RCP8.5 scenarios over the Godavari River Basin for different time slices.
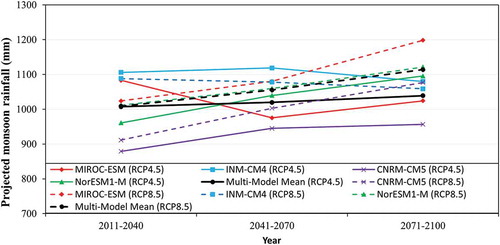
Table 4. Multi-model mean for present and future projected hydrological variables for the RCP4.5 and RCP8.5 scenarios over the Godavari River Basin (GRB).
Table 5. Changes in multi-model means between present and projected hydrological variables for the RCP4.5 and RCP8.5 scenarios.
Figure 13. Spatial pattern of changes in future projected hydrological components relative to present climate under the RCP4.5 scenario using multi-model means for different time slices over the Godavari River Basin.
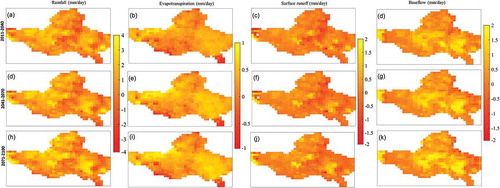
Figure 14. Spatial pattern of changes in future projected hydrological components relative to present climate under the RCP8.5 scenario using multi-model means for different time slices over the Godavari River Basin.
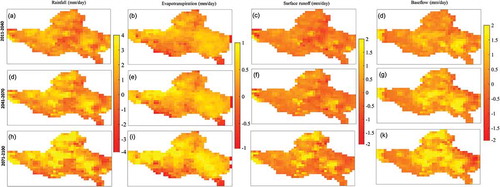
Table 6. Multi-model means of GCM-simulated and bias-corrected surface temperature under the RCP4.5 and RCP8.5 scenarios over the Godavari River Basin.