
Figures & data
Table 1. Validated empirical methods used to predict the hydraulic conductivity with the specific conditions of application. Note that Dα is the effective grain diameter (mm), where α is the cumulative weight percentage of smaller grain size. Cu: uniformity coefficient (= D60/D10); e: void ratio, n: porosity.
Figure 1. Mean monthly water isotope ratios in rainwater at Station CMP in comparison to long-term data from the Chapais station of the Global Network of Isotopes in Precipitation (GNIP). Only δ18O values are displayed, but δ2H values follow the same distribution, as shown by the local meteoric water line shown in .
Figure 2. Water isotope ratios in precipitation, with the local meteoric water line (LMWL) and the water isotope ratios in the soil water at sites C1 and C2.
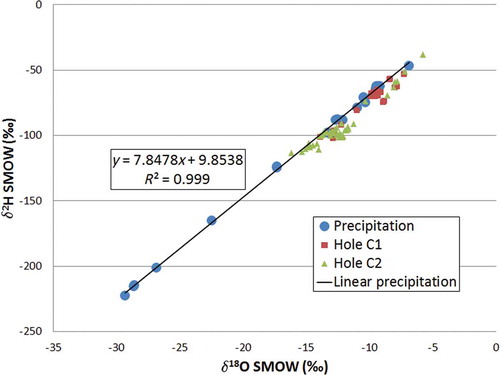
Figure 3. Water isotope profiles of (a) δ2H and (b) δ18O determined at sites C1 and C2. Note that y-axes have different scales and that the water isotope ratio profiles of pore-infiltrated water read chronologically from bottom to top of the vadose zone. Correspondences between isotope-profile-identified behaviours and time periods are noted in the figure.
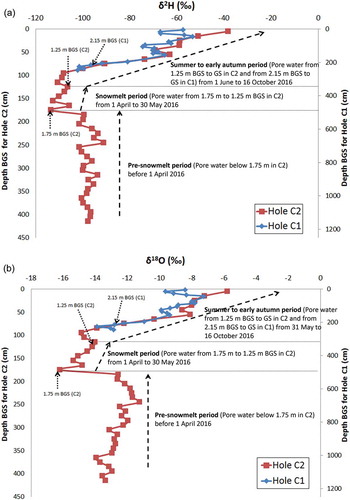
Figure 4. (a) Volumetric water content profiles at sites C1 and C2, and (b) degree of saturation (Sr) profiles at sites C1 and C2. The left-hand scale of depth is for the C2 profile and the right-hand scale is for the C1 profile.
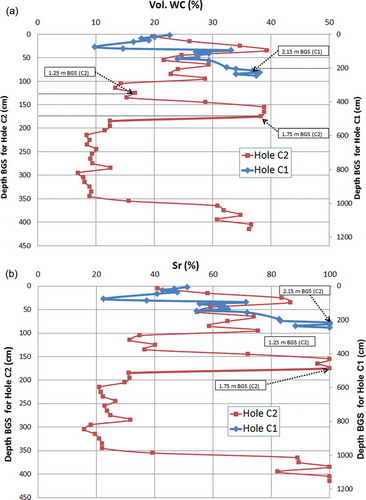
Figure 5. Volumetric water content profiles and snowmelt and precipitation data at (a) Site C2 and (b) Site C1. The correspondence between the infiltrated water and its origin (time period and age) is indicated on the two volumetric water content profiles.
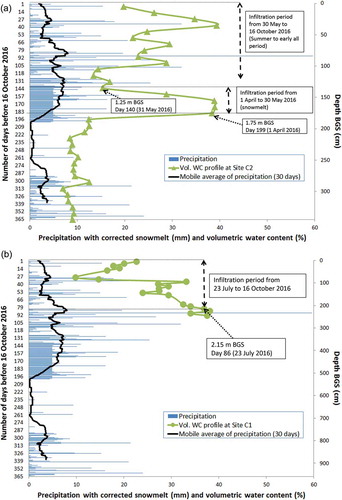
Figure 6. Grain-size sieve analysis results for sites C1 and C2 for the different ranges where the samples were identified to be similar and belonging to the same class of soil.
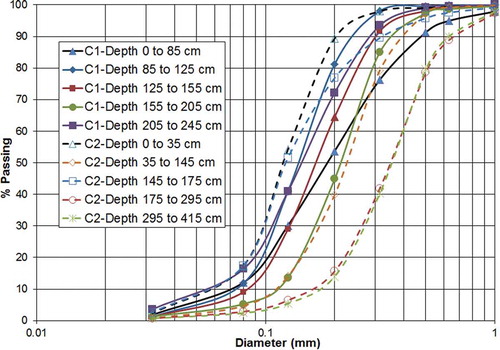
Table 2. Soil properties obtained from grain-size sieve analysis and from soil drying.
Figure 7. (a) Predicted Vol. WC curves at equilibrium for sites C1 and C2 and (b) predicted hydraulic conductivity curves at equilibrium for sites C1 and C2.
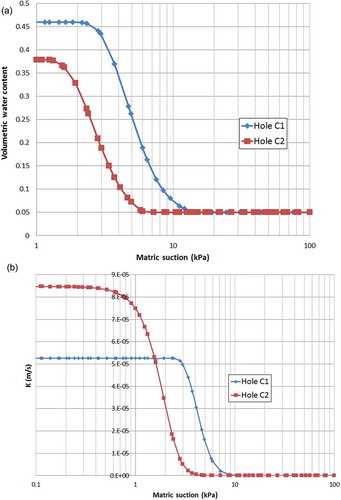
Table 3. Recharge for sites C1 and C2 calculated for different periods.