Figures & data
Figure 1. Location of the Shatt al-Arab River and the main features of the system.
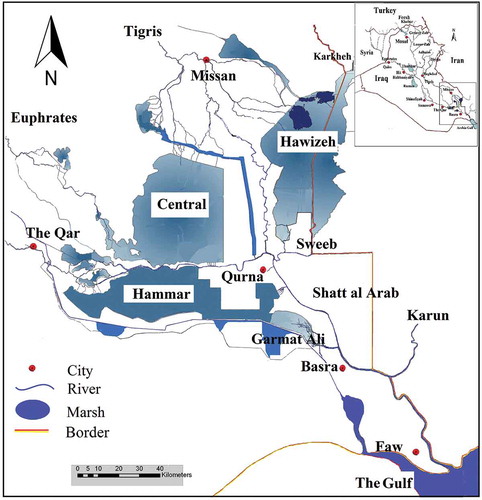
Figure 2. Schematic presentation of observation points 1–56 showing locations of domestic withdrawals (4), irrigation withdrawals (6), and drainage outfall (19).
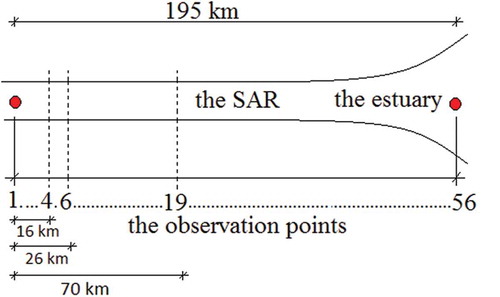
Table 1. Simulated scenarios (Sc) of salt concentration for different upstream conditions.
Figure 3. General framework of the multi-objective optimization–simulation model.
Figure 4. Flow duration curve of the SAR based on 1988–2010.
Figure 5. Salinity at withdrawals and outfall points (see for locations) for the six scenarios as a function of river-water salinity. Note that the axes have different scales for the different conditions. Grey represents the salinity where river water is not usable.
Figure 6. Salinity at withdrawals and outfall points for six scenarios as a function of water supply deficit. Note that the salinity y-axes have different scales for the different conditions.
Figure 7. Optimized salinity distribution along the SAR extracted from the 56 observation points (see ). Points D, I and O represent the locations of the withdrawals for domestic water supply, for irrigation water supply, and the outfall for drainage water, respectively (in grey: unfeasible solutions, i.e. average river water salinity >2.1 kg/m3).
Figure 8. Objective space of solutions for each of the six selected scenarios simulated 1000 times (in grey unfeasible solutions, i.e. average river water salinity >2.1 kg/m3).
Figure 9. Longitudinal salinity distribution considering different upstream conditions. Points D, I and O represent the locations of withdrawals for domestic water supply, irrigation water supply, and the outfall for drainage water, respectively.