Figures & data
Figure 1. Sub-catchment of the Morada Nova gauging station, located in the Jaguaribe basin, Ceará, Brazil. Blue dots represent the 16 reservoirs monitored by water agencies. The sub-catchment of the Senador Pompeu gauging station is located upstream of the Morada Nova station. See for details on the two catchments. The size of the blue dots represents reservoir storage capacity.
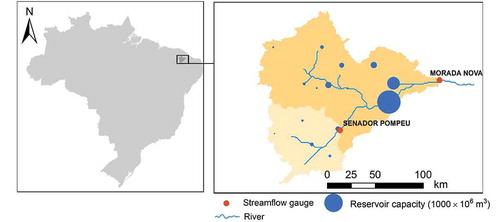
Figure 2. Schematic depiction of three situations of reservoir filling rates for a river basin with two reservoirs: (a) if the filling rates are equal the downstreamness of the stored volume (DSV) equals the downstreamness of storage capacity (DSC); (b) if the filling rate of the upstream reservoir is greater than that of the downstream reservoir, DSV is less than DSC; and (c) if the filling rate of the upstream reservoir is less than that in the downstream reservoir DSV is greater than DSC.
Figure 3. Temporal evolution of drought for the catchment upstream of the Morada Nova gauging station. SPI is based on a spatially averaged time series of monthly rainfall values for the entire catchment area. SSI values are based on a time series of streamflow observations for the Morada Nova gauging station.
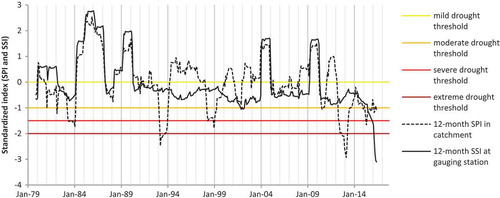
Figure 4. Drought development in the Morada Nova catchment for three multi-year droughts: (a) 1992–1996, (b) 1998–2003 and (c) 2012–2016. Periods with low values for both SPI and SSI are followed by periods with higher SPI and low SSI. SPI values refer to the 12-month SPI and SSI values refer to the 12-month SSI, both for the month of June (end of wet season).
Table 1. Drought indicators for gauging stations: SPI and SSI. Drought magnitude (DM) is the summation of SPI (or SSI) for all months of the drought.
Figure 5. Occurrence of meteorological and hydrological drought in the catchment of the Morada Nova gauging station for the 1979–2016 period.
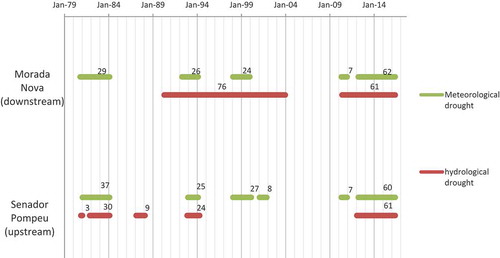
Figure 6. Downstreamness of the surface water storage capacity (DSC, solid grey line) and stored volume (DSV, solid black line) in the catchment of the Morada Nova gauging station as it developed over the 1986–2016 period. The slight decrease of the DSC and the increase in reservoir capacity are explained by an increase in reservoir capacity in areas located relatively upstream. Periods of interest are labelled 1, 2 and 3. During periods 1 and 2, meteorological droughts (low SPI and low SSI) were followed by a period of merely hydrological drought (low SSI), which coincided with drops in DSV. It is expected that the same may occur in the recent period of drought (period 3; low SPI, low SSI, low DSV).
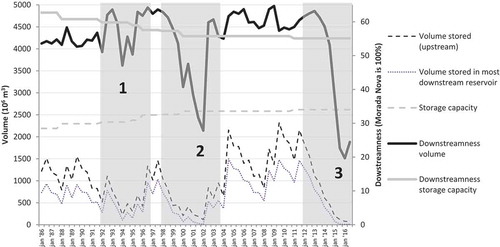
Figure 7. Two years after the meteorological drought had ended reservoir volume levels reached a low (1 January 2002). The level is particularly low in the largest reservoir located farthest downstream. This stored water volume distribution caused the human-modified hydrological drought at the outlet of the catchment to extend well beyond the meteorological drought and to last until the flood of 2004. During the same period, no hydrological drought occurred at the gauging station of Senador Pompeu, though the magnitude of the meteorological drought was worse there (see ).
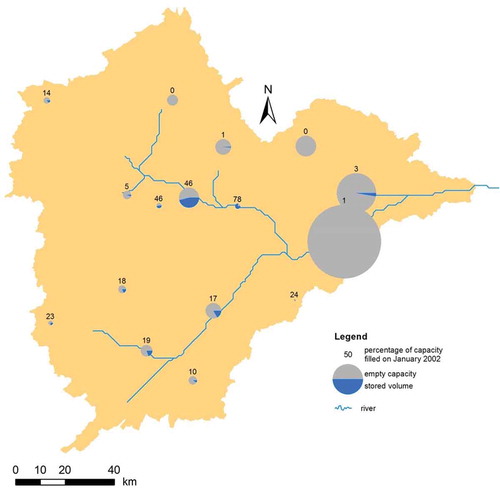
Figure 8. Drought development in the Morada Nova catchment for three multi-year droughts (a) 1992–1996, (b) 1998–2003 and (c) 2012–2016. Discharges (1 January–31 December) at the Morada Nova station and the stored volumes at 1 July in the upstream catchment. Upstream storage capacity during the study period increased by 14% from 133 mm (in 1990) to 152 mm (in 2016).
Figure 9. Conceptual representation of the relationship between drought indicators (SPI, SSI), DSV and DSC (left) and the relationship between upstream storage and downstream discharge (right). We found that recovery from drought is associated with a different pathway than the one associated with linear filling of the reservoirs across the basin (SNIF = 1).