
Figures & data
Figure 1. Geographical location of the study area within the municipality of Ivaí (Paraná, Brazil).
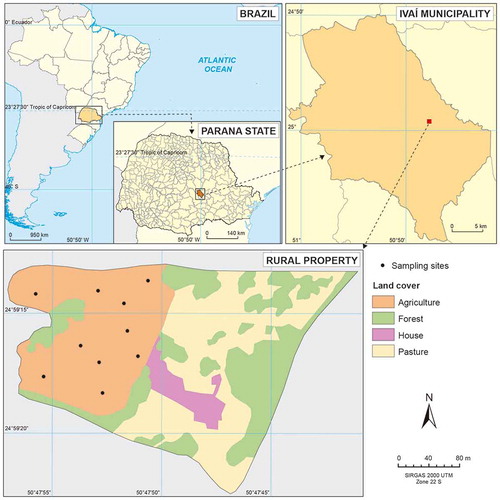
Figure 2. Technical characteristics of the installation of the Gerlach troughs: (a) planting, (b) harvesting, and (c) manual raingauge.
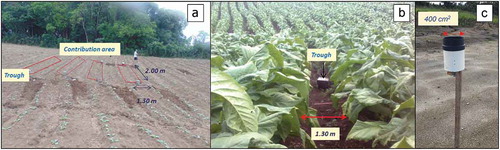
Table 1. Agricultural calendar for the farming activities. NT: no-tillage; CT: conventional tillage. Month in the form mm/yy.
Figure 3. Box plots of runoff coefficient per crop type during the studied period. The graphs above each box plot show the amount of rain that fell during each rainfall event.
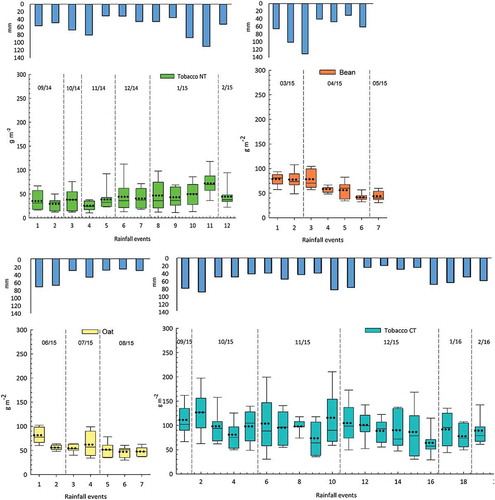
Figure 4. Box plots of soil loss rates per crop type during the studied period. The graphs above each box plot show the amount of rain that fell during each rainfall event.
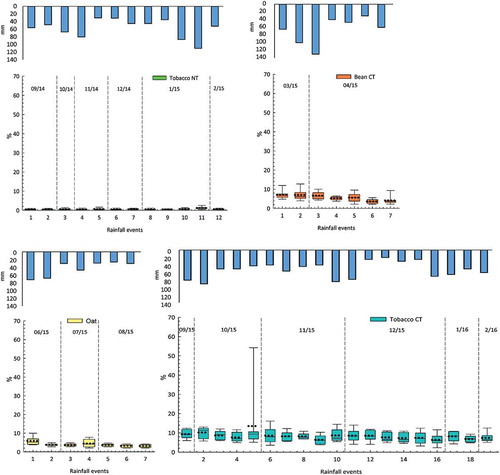
Figure 5. Scatter plots of rainfall (x-axis) and soil loss rates (y-axis) for different crops.
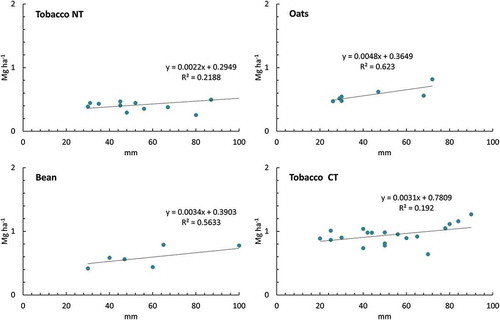
Figure 6. Scatter plots of bare soil percentage (x-axis) and soil loss rates (y-axis) for different crops.
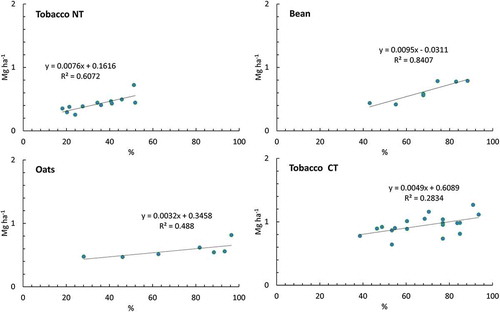
Table 2. Evolution of some soil properties during the study. OM: organic matter; BD: bulk density; NT: no-tillage; CT: conventional tillage.
Table 3. Analysis of the statistical differences between soil properties. Bold indicates statistical differences were found. NT: no-tillage; CT: conventional tillage; OM: organic matter; BD: bulk density.