Figures & data
Figure 1. Pathways of deriving river discharge information from GCMs. Based on downscaling method pathways reviewed in Xu (Citation1999).
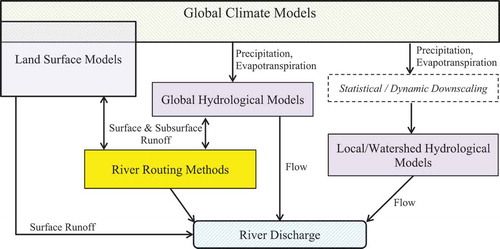
Table 1. Conceptual underpinnings of the river-routing models arranged in chronological order.
Table 2. Structural components and known applications of the river-routing models (RRM).
Table 3. Governing equations for storage-based routing schemes.
Figure 2. Dongjiang basin and validation of model with and without basic reservoir representation for the two main reservoirs based on discharge at downstream gauge at Boluo.
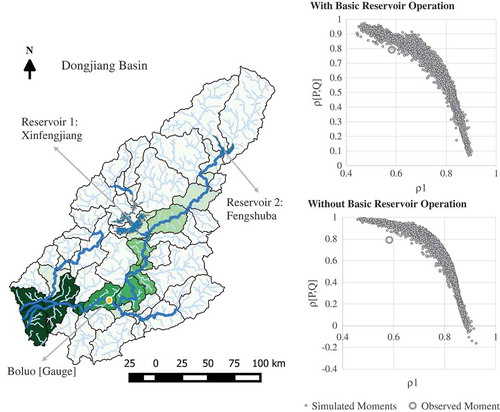
Table 4. Range of parameters of the abcd model for Monte Carlo simulations.
Figure 3. Average monthly discharge at Boluo with Pearson correlation coefficient and NSE between monitored data and simulated results.
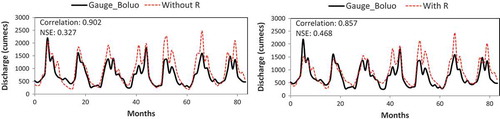
Figure 4. High-resolution tracking of surface water dynamics using remotely sensed optical imagery, demonstrated using 30-m resolution LandSAT imagery over the Pearl River Estuary and Lower Dongjiang River Basin. Map extracted from results of an algorithm tracking change of Water Occurrence Change Intensity between 1984 and 2015 developed by Pekel et al. (Citation2016).
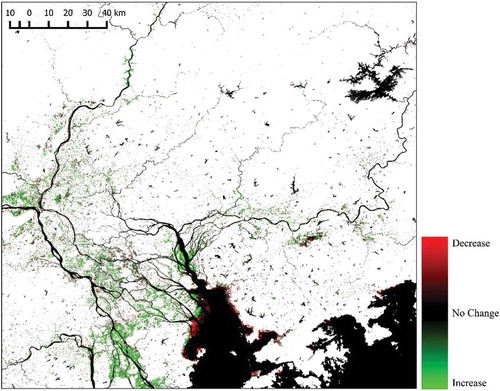
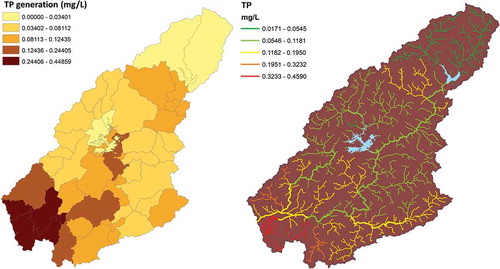
Figure 5. Annual average total phosphorus (TP) load generation and routing through the river network.