Figures & data
Figure 1. Location of operational raingauges, OzNet monitoring sites, streamgauges and the two focus sub-catchments (Kyeamba and Adelong) in the Murrumbidgee catchment that are used in this study.
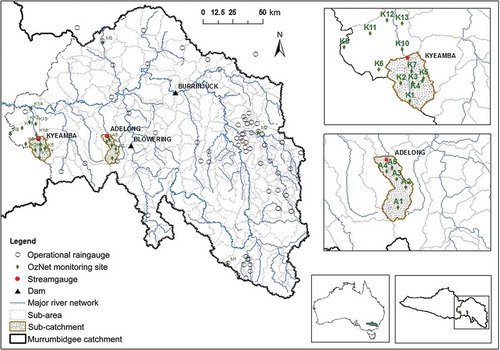
Figure 2. Cumulative rainfall from OzNet sites in the (a) Kyeamba and (b) Adelong sub-catchments compared with cumulative interpolated operational rainfall in the sub-catchment. Comparison is for the period 2007–2010.
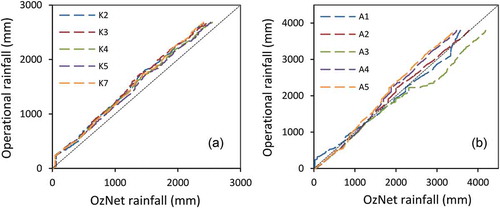
Figure 3. Structure of the (a) GR4H and (b) PDM models.
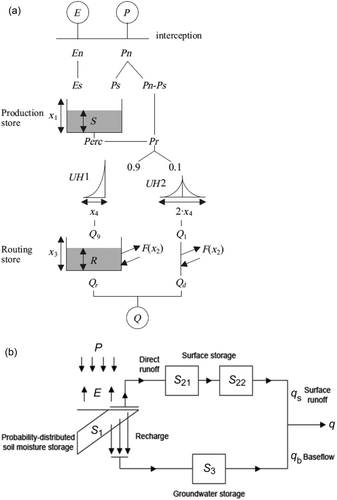
Table 1. Optimized parameters for GR4H and PDM for calibration to streamflow (SF-cali.) and joint-calibration with normalized soil moisture (Joint-cali.) in the Kyeamba and Adelong sub-catchments.
Figure 4. Observed OzNet (calibration period) and operational (validation period) rainfall, and observed and simulated streamflow for calibration to streamflow from (a) GR4H and (b) PDM, and calibration to both streamflow and soil moisture from (c) GR4H and (d) PDM, for the Upper Kyeamba sub-catchment.
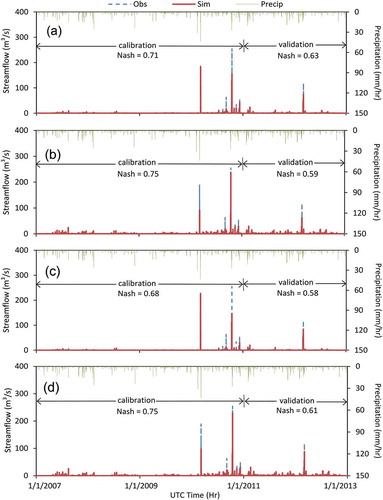
Figure 5. Same as , but for the Adelong Creek sub-catchment.
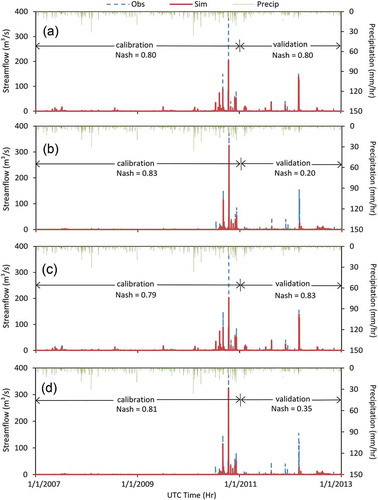
Figure 6. Scatter plots of observed and simulated streamflow from calibration to streamflow alone (SF-cali) and joint-calibration (Joint-cali) to streamflow and average soil wetness observations for (a and c) GR4H and (b and d) PDM in the (a and b) Kyeamba and (c and d) Adelong sub-catchments.
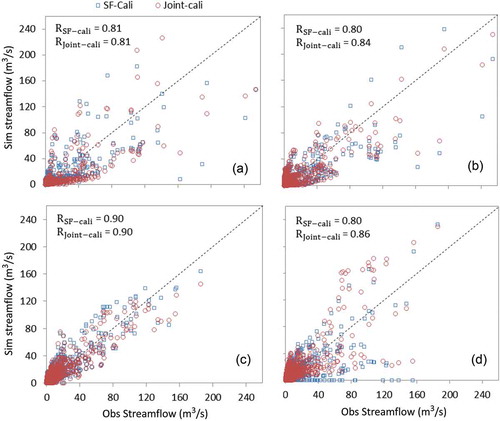
Table 2. NSE scores of observed and simulated streamflow modelling and RMSE (%) of observed and simulated soil wetness from calibration to streamflow alone (SF-cali.), and calibration to both streamflow and soil moisture (Joint-cali.) in the Kyeamba (K) and Adelong (A) sub-catchments for GR4H and PDM. The NSE scores are shown for calibration with OzNet rainfall (2007–2010, Cal.), validation with OzNet rainfall (2011–2012, Val.1), validation with operational rainfall (2007–2010, Val.2 and 2011–2012, Val.3); the RMSE results are shown for Cal. and Val.3.
Figure 7. Observed and simulated soil wetness for (a) GR4H and (b) PDM for the calibration period in the Upper Kyeamba sub-catchment; calibration is to streamflow alone (SF-cali) and to streamflow and soil moisture jointly (Joint-cali). OzNet rainfall data are used for the calibration.
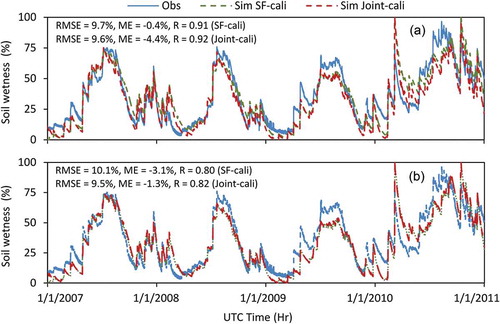
Figure 8. Same as , but for the Adelong Creek sub-catchment.
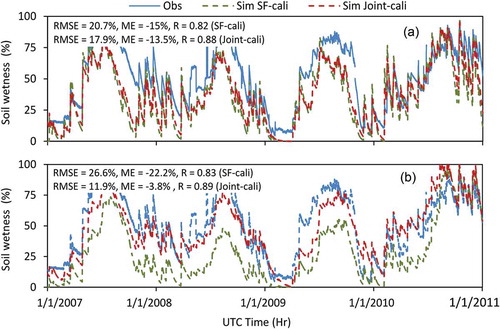
Figure 9. Observed and simulated soil wetness for (a) GR4H and (b) PDM for the validation period in the Upper Kyeamba sub-catchment; calibration is to streamflow alone (SF-cali) and to streamflow and soil moisture jointly (Joint-cali). Operational rainfall data are used for the validation.
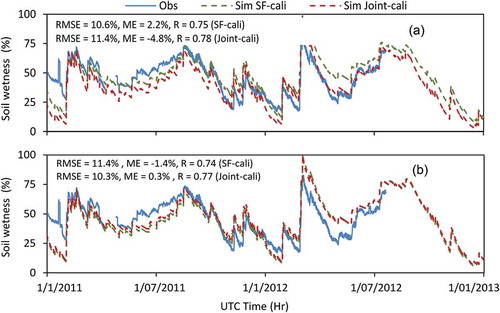
Figure 10. Same as , but for the Adelong Creek sub-catchment.
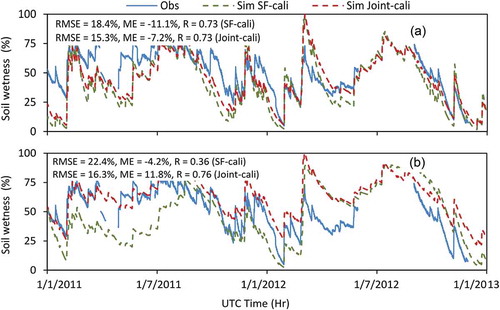
Figure 11. Comparison of observed and simulated streamflow and soil wetness from (a) and (b) GR4H and (c) and (d) PDM for a calibration event (left) using OzNet rainfall data, and a validation event (right) using operational rainfall data, after calibration to only streamflow (SF-cali) and calibration to both streamflow and soil moisture (Joint-cali) in the Upper Kyeamba Creek sub-catchment.
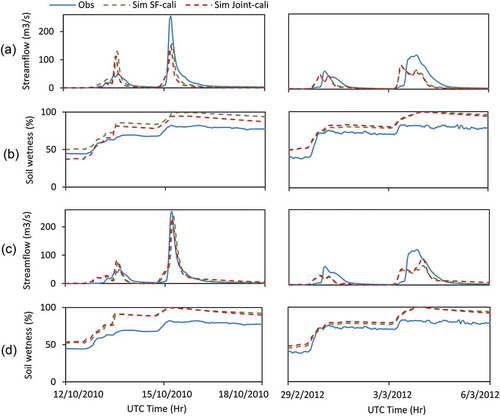
Figure 12. Same as , but for the Adelong Creek sub-catchment.
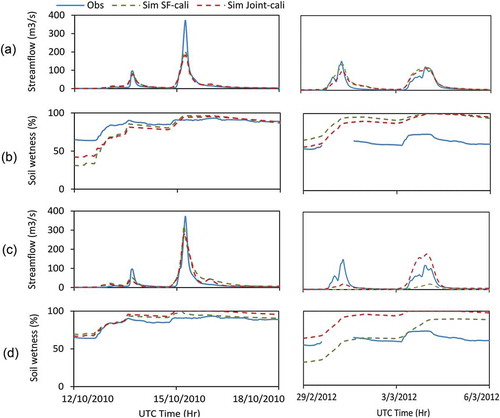
Table 3. Summary of streamflow prediction errors (%) from GR4H and PDM, rainfall amount relative to duration (mm h−1), modelled pre-event soil wetness (%), and observed peak flow (m3 s−1) for the events in October 2010, and February and March 2012 in Kyeamba (K) and Adelong (A).
Table 4. Comparison of NSE for streamflow modelling in the Kyeamba and Adelong sub-catchments after calibration to streamflow alone (SF-cali), after joint-calibration to streamflow and soil wetness from each station (K1, K2, K3, K4, K5 and K7; A1, A2, A3, A4 and A5), and after joint-calibration streamflow and average soil wetness observation (Ave) for the calibration (Cal.) and validation (Val.) periods. The NSE scores are not shown for the stations where no sufficient soil wetness data were available over the validation period.
Figure 13. RMSE and the correlation coefficient (R) between observed and simulated soil wetness from (a) and (c) GR4H and (b) and (d) PDM after calibration to streamflow alone for the calibration (SF-cali (Cal)) and validation (SF-cali (Val)) periods and after joint-calibration to streamflow and soil wetness observations from each station (K1, K2, K3, K5 and K7) or average soil wetness (Ave) for calibration (Joint-cali (Cal)) and validation periods (Joint-cali (Val)) in the Kyeamba sub-catchment. The scores are not shown for the stations where no sufficient soil wetness data were available over the validation period.
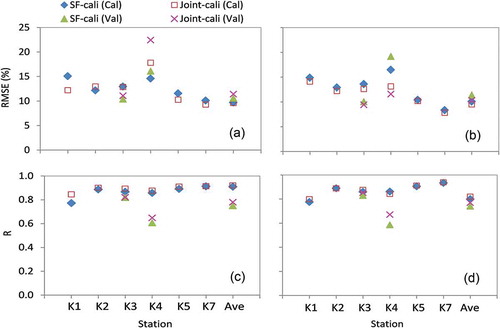
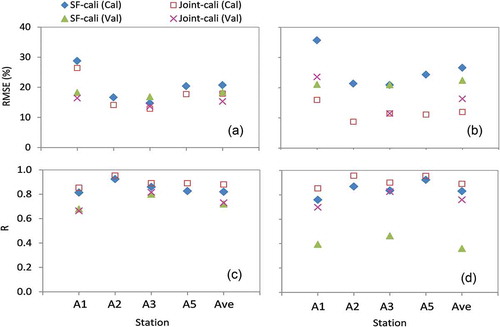
Figure 14. Same as , but for soil wetness observations from each station (A1, A2, A3 and A5) or average soil wetness (Ave) in the Adelong sub-catchment. The scores are not shown for A4 and other stations where no sufficient soil wetness data were available over the calibration or validation period.