
Figures & data
Figure 1. Location and topography of the Mid-Eastern Yanqi Basin. I–I′ and II–II′ are the lines of cross-sections in .
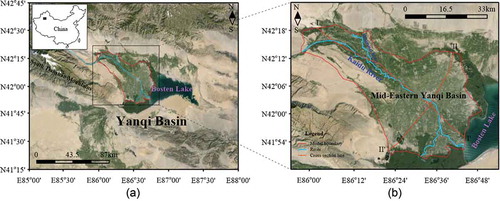
Figure 2. (a) Elevation of the study region, and (b) distribution of diversion ditches, drainage ditches and division of the river channel in the MEYB.
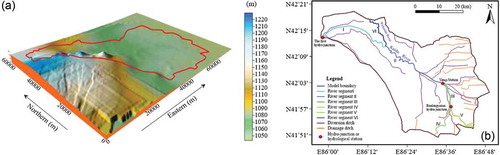
Table 1. Annual variation in Kaidu River runoff at different stations (2000–2013).
Figure 3. Schematic hydrogeological cross-section and groundwater system oriented west to east through the aquifer of the entire Yanqi Basin.
Figure 4. Hydrogeological cross-sections of the MEYB along the lines I–I′ and II–II′ (see ).
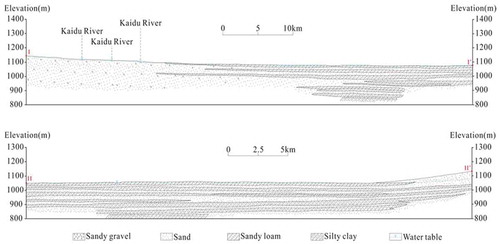
Figure 5. (a) Spatial discretization of the modelled domain and the prescribed boundary conditions; (b) distribution of hydraulic conductivity; and (c) distribution of specific yield in the model.
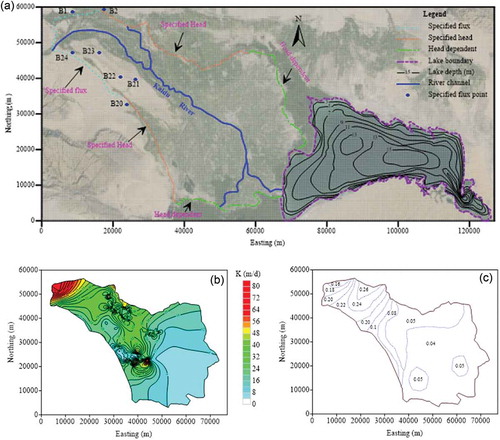
Figure 6. (a) Zonation of recharge coefficient of precipitation infiltration; (b) distribution of evapotranspiration coefficient; (c) precipitation and evaporation, and inflow/outflow of Bosten Lake; and (d) inflow and diversion of main segments within the study region.
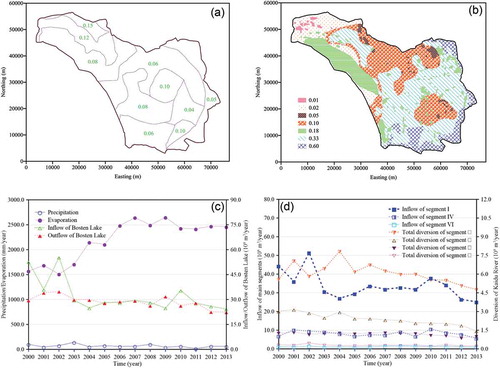
Figure 7. (a) Comparison of observed and calculated hydraulic head contours in 1999; (b) comparison of observed and computed groundwater heads at all observation wells; (c) groundwater level contours in November 2013; and (d) observed vs computed heads over time at three typical observation locations, indicated in (a).
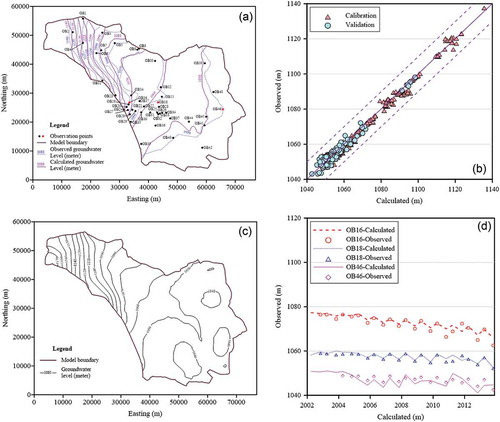
Table 2. Overall water budget of the simulation period 2000–2013 (108 m3/year). PRE: precipitation; IS: irrigation seepage; DS: diversion system seepage; LR: lateral recharge; WFS: water quantity from storage; RS: river seepage; DRN: drainage; ET: evapotranspiration; WIB: water flow into Bosten Lake; GE: groundwater exploitation.
Figure 8. (a) Annual mean groundwater budget for MEYB (108 m3/year); and (b) variation of the main components of inflow and outflow in the groundwater budget.
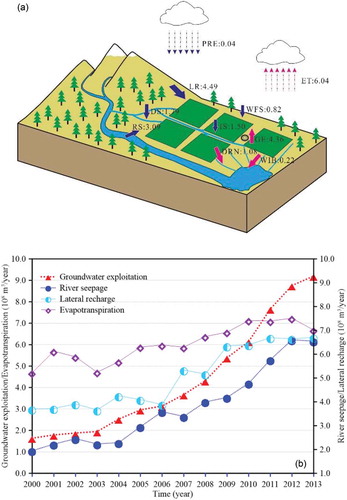
Table 3. Coefficients of correlation (R) between all components in the groundwater budget. See for explanation of abbreviations. Bold values indicate highly positive correlations (R > 0.9).
Table 4. Interaction between different river segments and groundwater system. A positive value represents the aquifer gaining water from the river; and a negative value represents the aquifer losing water to the river.
Figure 9. Variation in leakage for different river segments over time (2000–2013). Positive values represent the aquifer gaining water from the river and negative values represent the aquifer losing water to the river.
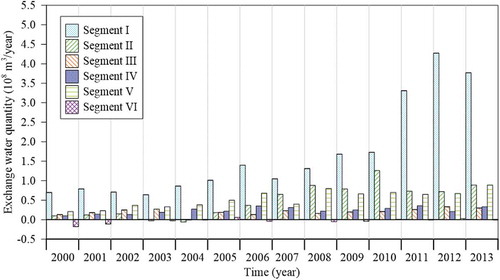
Figure 10. Changing water levels observed at the first hydro-junction (top), and in Yanqi hydrological station and Bosten Lake (bottom).
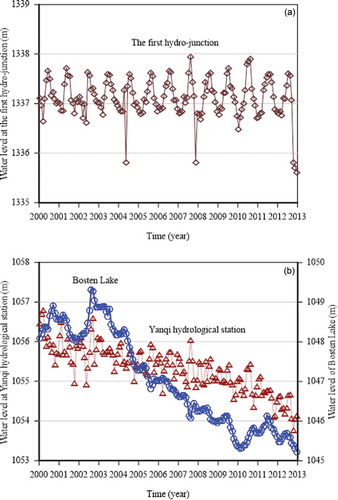
Table 5. Error analysis of the calculated runoff. RE: relative error; ME: mean error; MAE: mean absolute error; RMSE: root mean square error; E: Nash-Sutcliffe efficiency; R: correlation coefficient; QR: qualification rate.
Figure 11. Comparison of observed and computed runoff of Kaidu River at (a) Yanqi hydrological station and (b) Baolangsumu hydro-junction.
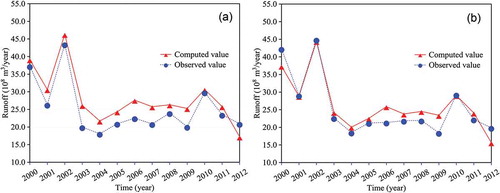
Figure 12. Flow rates from Kaidu River to Bosten Lake in the period 2000–2013.
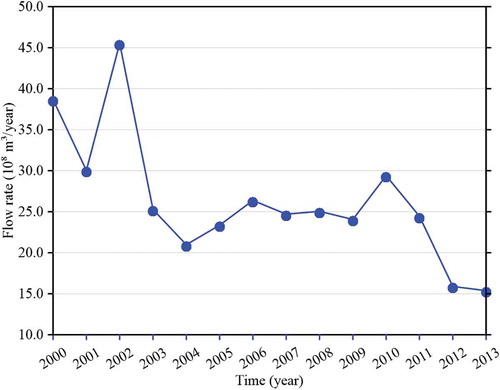
Figure 13. Sensitivity analyses of inflow to Bosten Lake with respect to different model input parameters.
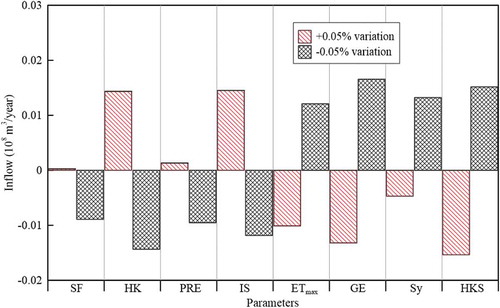
Table 6. Results of the parameter sensitivity analysis. SF: specified flux; HK: horizontal hydraulic conductivity; PRE: precipitation; IS: irrigation seepage; ETmax: maximum ET rate; GE: groundwater exploitation; Sy: specific yield; HKS: hydraulic conductivity of stream bed. The ranking of sensitivity is relative: 1 indicates the highest sensitivity and 8 the lowest sensitivity.