Figures & data
Figure 1. Location of the study sites on the Tibetan Plateau in China.
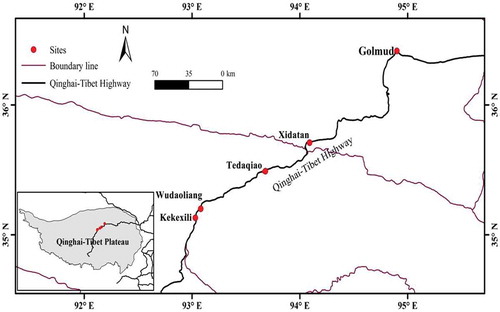
Figure 2. Surface vegetation cover at the four monitoring sites: (a) alpine meadow (XDT: AM1); (b) alpine desert steppe (QTB06: ADS); (c) alpine steppe (QTB07: AS); and (d) alpine meadow (QT01: AM2).
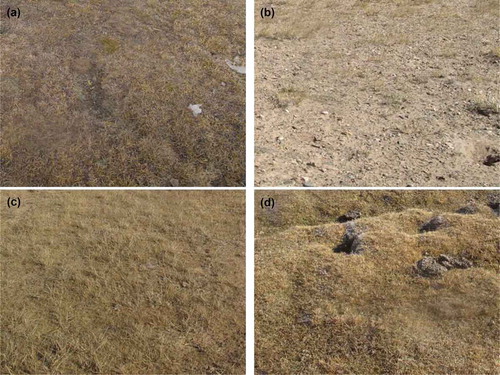
Figure 3. Variation of soil initial infiltration rate, and soil moisture and soil texture for different underlying surfaces: alpine meadow (AM1: XDT and AM2: QT01) alpine desert steppe (ADS: QTB06) and alpine steppe (AS: QTB07).
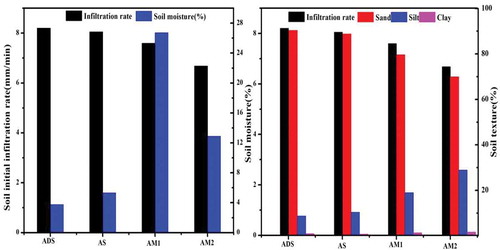
Figure 4. Soil initial infiltration processes for different underlying surfaces: alpine meadow (AM1: XDT and AM2: QT01), alpine desert steppe (ADS: QTB06) and alpine steppe (AS: QTB07).
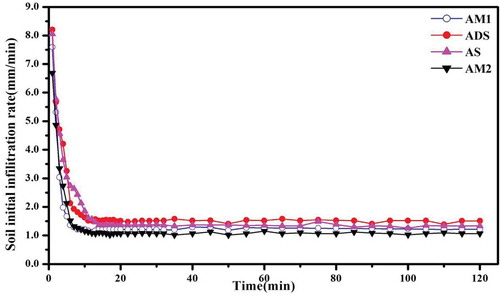
Figure 5. Variation of soil steady infiltration rate, and soil moisture and soil texture for different underlying surfaces: alpine meadow (AM1: XDT and AM2: QT01), alpine desert steppe (ADS: QTB06) and alpine steppe (AS: QTB07).
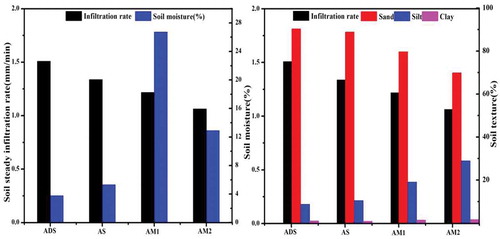
Figure 6. Variation of cumulative soil infiltration for different underlying surfaces: alpine meadow (AM1: XDT and AM2: QT01), alpine desert steppe (ADS: QTB06) and alpine steppe (AS: QTB07).
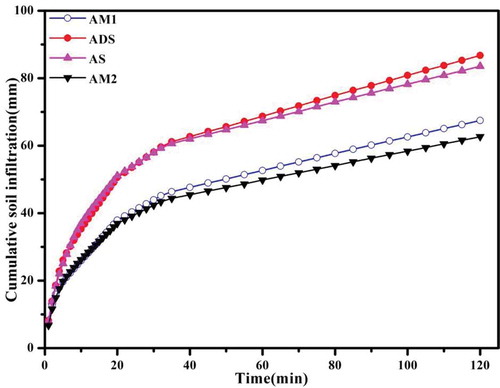
Table 1. Geographical characteristic of the four monitoring sites.
Table 2. Soil physical properties of the four monitoring sites.
Table 3. Soil infiltration rate model parameters of the four monitoring sites.
Table 4. Performance of different models for fitted soil infiltration rate against the observations at different sites. R2: standard error of the estimate; RMSE: root mean square error; MAE: mean absolute error. KM: Kostiakov model; GM: general empirical model; HM: Horton model; and MM: Mezencev model.
Figure 7. Comparison between measured and fitted soil infiltration rate for different underlying surfaces: (a) alpine meadow (AM1: XDT); (b) alpine desert steppe (ADS: QTB06); (c) alpine steppe (AS: QTB07); and (d) alpine meadow (AM2: QT01). KM: Kostiakov model, GM: General empirical model, HM: Horton model, MM: Mezencev model.
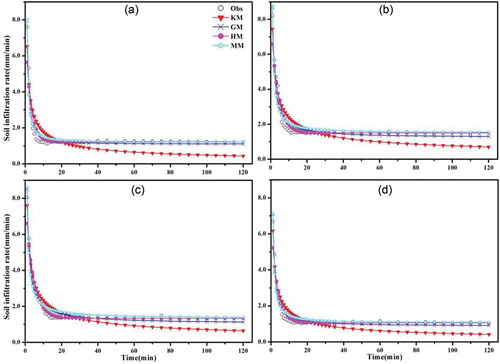
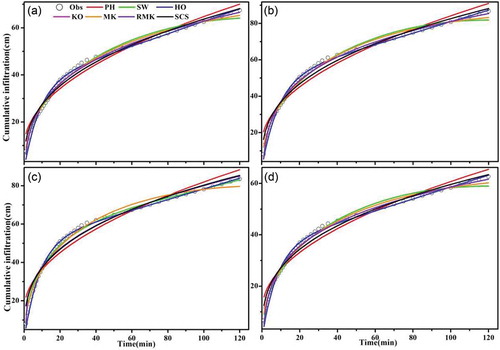
Table 5. Performance of different models for fitted soil cumulative infiltration against the observations at different sites. PH: Philip model; SW: Swartzendruber model; HO: Horton model; KO: Kostiakov model; MK: modified Kostiakov model; RMK: revised MK model; SCS: SCS model.
Figure 8. Comparison between the measured and fitted soil cumulative infiltration under underlying surfaces: (a) alpine meadow (AM1: XDT); (b) alpine desert steppe (ADS: QTB06); (c) alpine steppe (AS: QTB07); and (d) alpine meadow (AM2: QT01). PH: Philip model, SW: Swartzendruber model, HO: Horton model, KO: Kostiakov model, MK: modified Kostiakov model, RMK: Revised MK model, SCS: SCS model.