Figures & data
Figure 1. Lower Yom River Basin showing the 14 water sampling points.

Table 1. Location of surface water stations.
Table 2. Data sources for the SWAT (Soil and Water Assessment Tool) model.
Figure 2. Spatial input maps for the SWAT model in the Lower Yom River showing (a) the digital elevation model (DEM), (b) soil groups, (c) land use in 2003, and (d) land use in 2009.
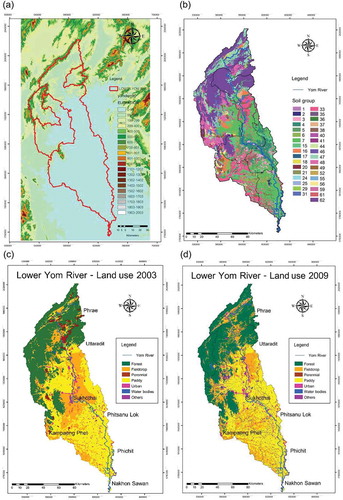
Figure 3. Observation stations in the Lower Yom River Basin used for the SWAT model calibration and validation.
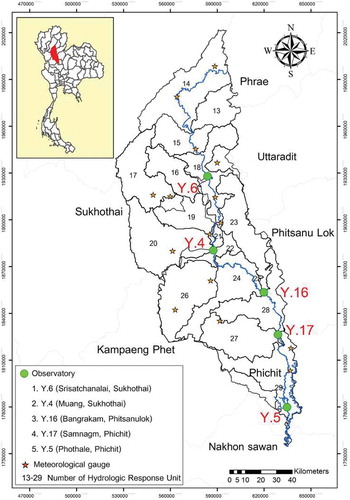
Figure 4. Calibration and validation periods of (a) streamflow, (b) sediment and (c) nitrate and phosphate.
Table 3. Location of the hydrological observation stations used for the calibration and validation of flow, sediment yields and NO3− and PO43− levels.
Figure 5. Analysis of water quality of the Lower Yom River Basin showing the average temperature, pH, dissolved oxygen (DO), biochemical oxygen demand (BOD), NO3-N and PO43− levels.
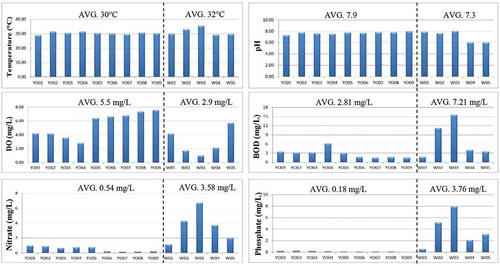
Figure 6. Comparison of the observed and simulated results for the monthly water flow (m3 s−1; CMS) at, from top to bottom, hydrological stations Y.6 (R2 = 0.85), Y.4 (R2 = 0.77), Y.16 (R2 = 0.74), Y.17 (R2 = 0.71), and Y.5 (R2 = 0.71).
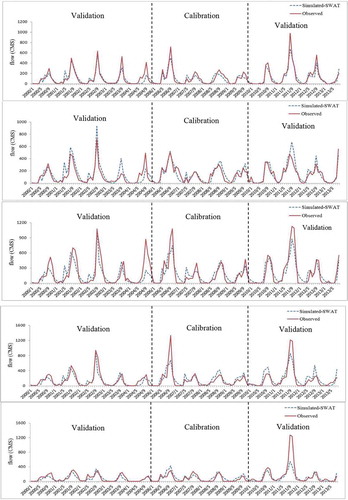
Figure 7. Comparison of the observed and simulated results for monthly sediment yield at, from top to bottom, hydrological stations Y.6 (R2 = 0.69), Y.4 (R2 = 0.64), Y.16 (R2 = 0.71), Y.17 (R2 = 0.63), and Y.5 (R2 = 0.68).
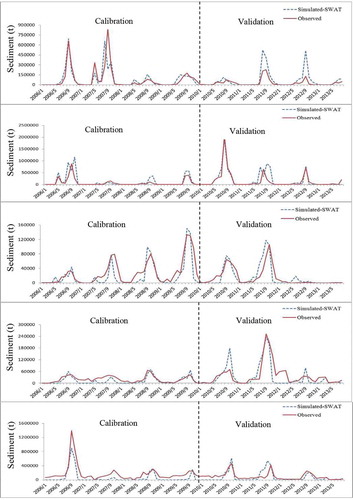
Figure 8. Comparison of the observed and simulated results for the river water NO3-N concentrations at, from top to bottom, hydrological stations Y.6 (R2 = 0.66), Y.4 (R2 = 0.73), Y.16 (R2 = 0.86), Y.17 (R2 = 0.64), and Y.5 (R2 = 0.70).
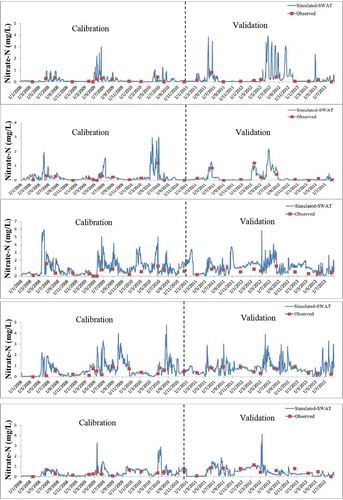
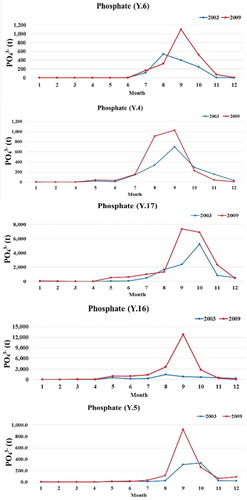
Figure 9. Comparison of the observed and simulated results for the river water PO43− concentrations at, from top to bottom, hydrological stations Y.6 (R2 = 0.70), Y.4 (R2 = 0.61), Y.16 (R2 = 0.87), Y.17 (R2 = 0.91), and Y.5 (R2 = 0.65).
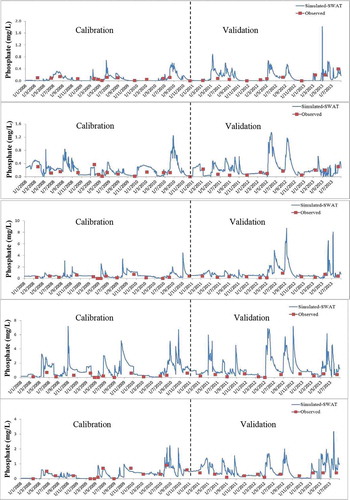
Table 4. Description and optimal values used in the SWAT model calibration/validation.
Table 5. Change detection for the Lower Yom River, 2003–2009.
Figure 10. Land-use changes in the Lower Yom River from 2003 to 2009.
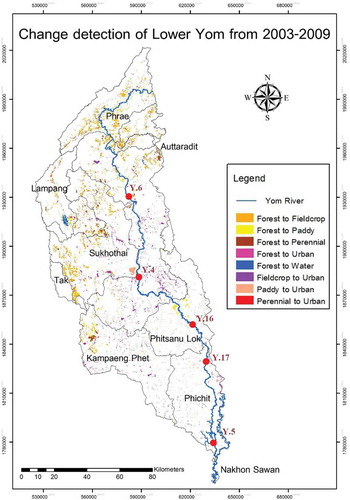
Figure 11. Effects of land-use change between 2003 and 2009 on the runoff (m3 s−1; CMS).
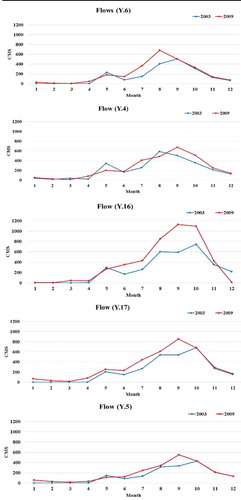
Figure 12. Effect of land-use change between 2003 and 2009 on (a) annual runoff, (b) sediment yield, (c) NO3−, and (d) PO43− levels in the Lower River Yom Basin.
Figure 13. Effects of land-use change (2003–2009) on sediment yield.
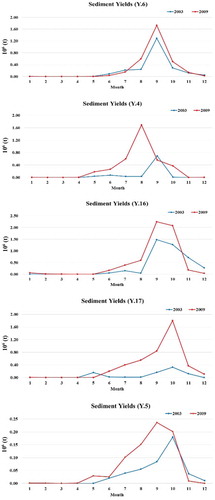
Figure 14. Effects of land-use change (2003–2009) on NO3-N load in the Lower Yom River Basin.
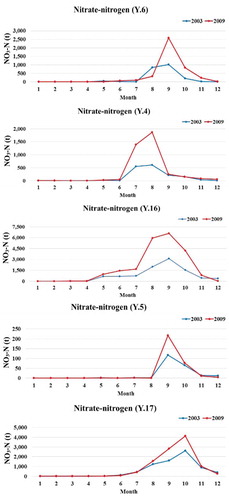
Table 6. Nitrate load observed in this study compared to previous studies around the world (modified from Huang et al. Citation2012, Oeurng et al. Citation2016).
Figure 15. Effects of land-use change (2003–2009) on PO43− load in the Lower River Yom Basin.