Figures & data
Table 1. Comparison of design criteria for infiltration trenches of rectangular cross-section. hmax: maximum water depth, H: separation between trench bottom and GW level.
Figure 1. Rectangular cross-section of infiltration trench of width b and length L showing the infiltration concept of Type II at two phases: 1 – the left half (filling), and 2 – the right half (emptying).
Figure 2. Scheme showing the infiltration concept of Type IIIa and distribution of infiltration rate fc along the wetted perimeter of a rectangular trench.
Figure 3. Distribution of infiltration velocity w and mean infiltration rates fc (Type IIIb).
Figure 4. Sketch of the infiltration trench in the 2D numerical model.
Table 2. Physical parameters of soils in the infiltration trench.
Figure 5. Comparison of results obtained using different infiltration concepts with field data.
Figure 6. Velocity distribution (cm min−1) at the end of water inflow to the trench at initial soil moisture: (a) θ = 0.2 and (b) θ = 0.35.
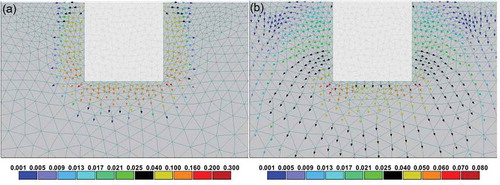
Figure 7. Relative mean infiltration rates fc/Ks versus relative water depth h/b: according to DWA (Deutsche Vereinigung für Wasserwirtschaft, Abwasser und Abfall) (Citation2005). Dotted line: Iz = 1, dashed line: Type II, solid line: Type IIIb.