
Figures & data
Figure 1. Locations of the Lancang (LRB) and Yarlung Zangbo (YRB) river basins and meteorological stations in the two basins.
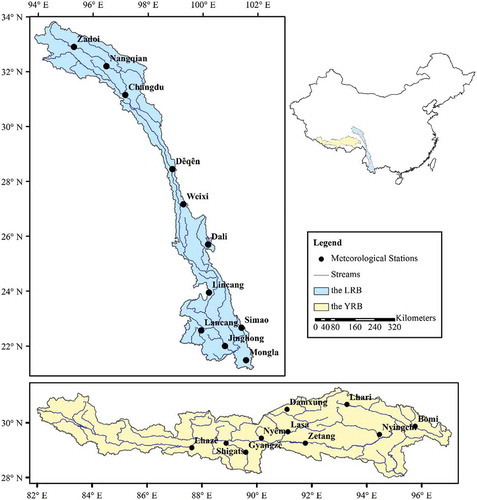
Figure 2. Analysis framework of this study.
Figure 3. (a) Trend-free time series; (b) increasing time series; and (c) decreasing time series.
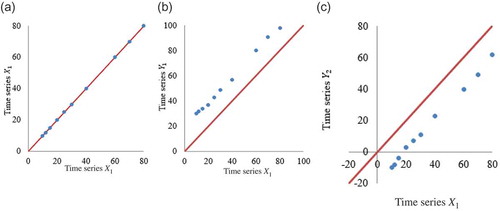
Figure 4. Mann-Kendall statistic (Z) values of monthly and annual PET in the Lancang River Basin.
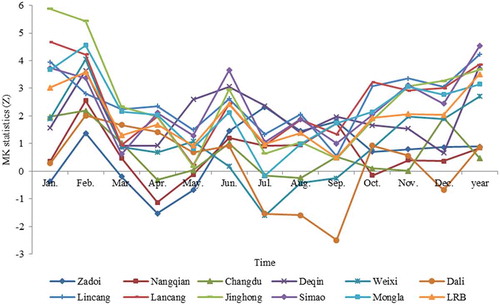
Figure 5. Original annual PET series of the LRB and the five representative stations.
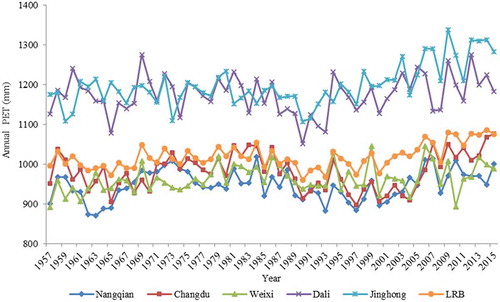
Figure 6. Diagnosis graphs of annual PET for (a) the LRB and the representative stations: (b) Nangqian, (c) Changdu, (d) Weixi, (e) Dali and (f) Jinghong.
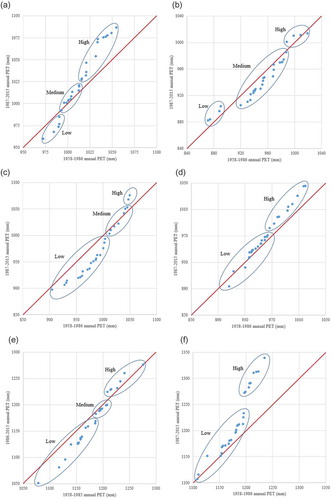
Figure 7. Mann-Kendall statistic (Z) values of monthly and annual PET in the Yarlung Zangbo River Basin.
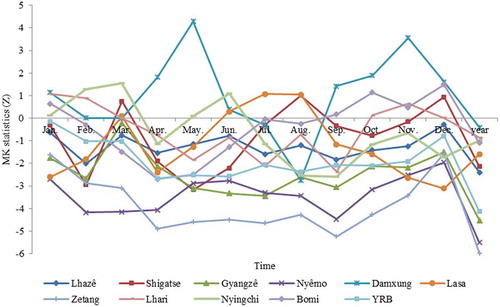
Figure 8. Original annual PET series of the YRB and the five representative stations.
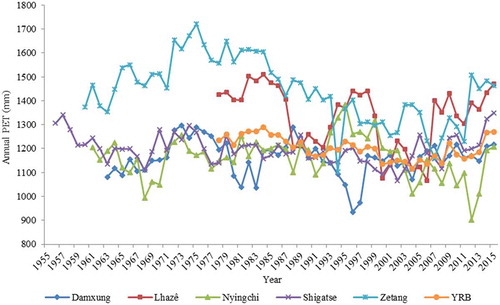
Figure 9. Diagnosis graphs of annual PET for (a) the YRB and the representative stations: (b) Lhazê, (c) Shigatse, (d) Damxung, (e) Zetang and (f) Nyingchi.
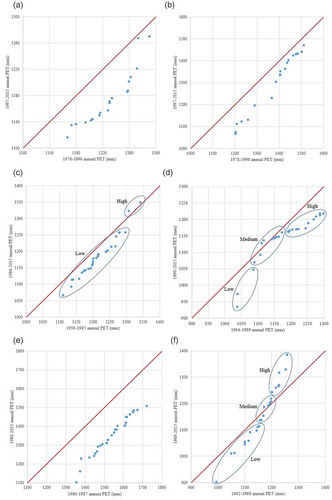
Table 1. Lancang River Basin – coefficient of determination values (95% probability) for the ANOVA models: (i) including single factor effects (R12) and (ii) including both single factor effects and those from interactions between two factors (R22). Δ: difference between R12 and R22.
Table 2. Yarlung Zangbo River Basin – coefficient of determination values (95% probability) for the ANOVA models (i) including single factor effects (R12) and (ii) including both single factor effects and those from interactions between two factors (R22). Δ: difference between R12 and R22.