Figures & data
Figure 1. Schematic of the probabilistic framework for spatial uncertainty analysis of flood characteristics. LHS: Latin hypercube sampling; AMC: antecedent moisture condition; pdf: probability density function; UM: uncertainty map.
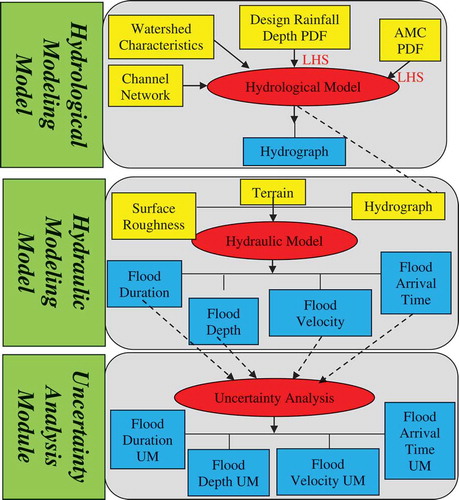
Table 1. Variation of the flood characteristics with space and time.
Figure 2. Watershed location along with the computational domain and inflow location for hydraulic modeling.
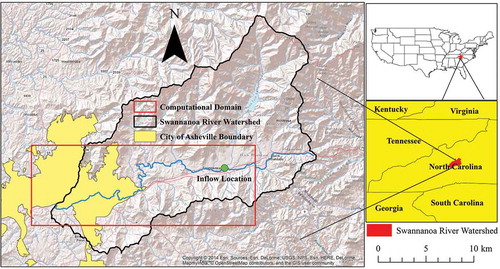
Figure 3. 100-year design hydrographs at inflow location (upstream boundary of hydraulic model).
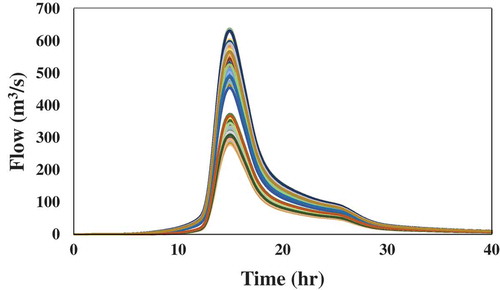
Figure 4. Empirical cumulative distribution of the spatially lumped flood characteristics: (a) maximum extent, (b) average maximum depth, and (c) average maximum velocity. RIL: Relative interval length.
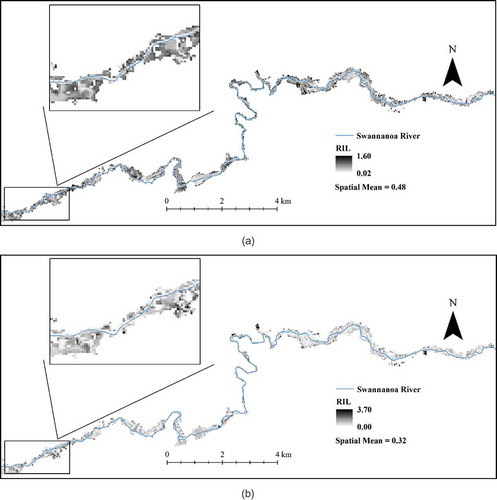
Figure 5. Uncertainty map of the space-variant flood characteristics: (a) maximum depth, (b) maximum velocity, (c) duration, (d) arrival time, and (e) time of maximum inundation. RIL: Relative interval length.
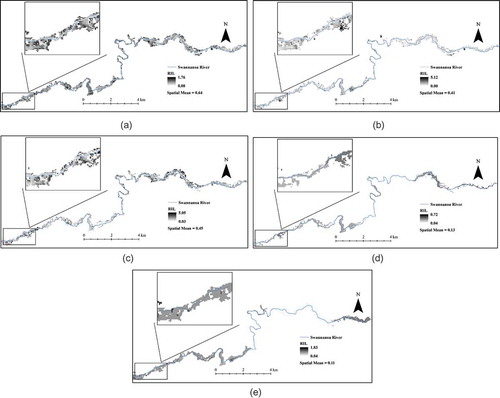
Figure 6. Percentage of the inundation area for which each space-variant flood characteristic is least/most uncertain.
Figure 7. Empirical cumulative distribution of the temporal mean flood extent. RIL: Relative interval length.
Figure 8. Uncertainty map of the time-variant flood characteristics: (a) mean depth and (b) mean velocity. RIL: Relative interval length.