
Figures & data
Table 1. Detailed description of the Chhota Shigri Glacier.
Figure 1. Study area along with sample locations: (a) glacier ice surface, (b) supraglacial channel and (c) discharge measurement site (~3800 m a.s.l.) in the Chhota Shigri Glacier catchment.
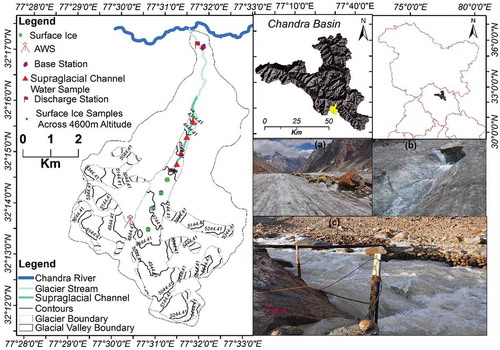
Table 2. Detailed description (number of samples, sampling period and sampling frequency) of water source components (end members) and mixed components (glacial discharge) at Chhota Shigri Glacier.
Figure 2. Hydrological and meteorological observations at Chhota Shigri Glacier for the complete summer ablation season.
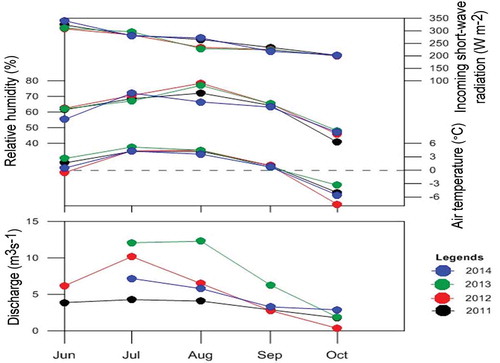
Figure 3. Box-and-whisker plots for (a) δ18O and (b) electrical conductivity of different types of water source and stream samples. The whiskers represent the 10th and 90th percentiles, while the box limits indicate the 25th and 75th percentiles, and the lines inside the box represent the median. R: rainfall; SP: winter snowpack; GS: glacier surface ice: SC: supraglacial channel water; MSTR: morning stream water; ESTR: evening stream water (where morning is 08:00 h and evening 18:00 h).
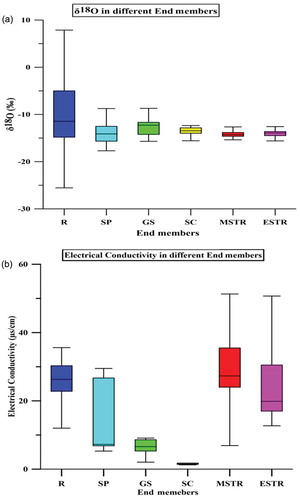
Figure 4. (a) Regression line (dashed green) between δ18O and δD values of rainwater samples (n = 35) at Chhota Shigri Glacier during the entire ablation season. Meteoric water lines (MWL) are as follows: dashed brown: Mediterranean MWL, dashed blue: Western Himalayan MWL, and solid black: global MWL. (b) Variation of d-excess and isotope (δ18O) in rainwater samples collected at the base station of Chhota Shigri Glacier (CS) during June–October.
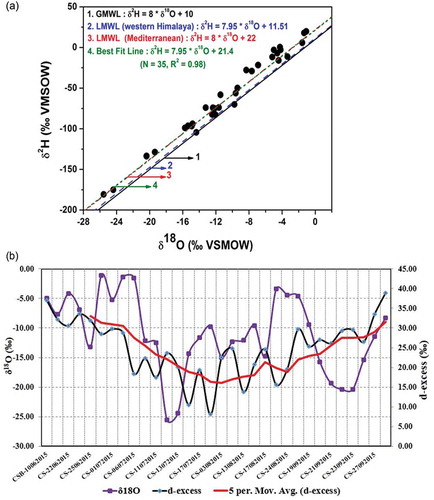
Figure 5. Relationship between δD and δ18O values of glacier surface ice, winter snowpack and supraglacial meltwater collected during the monitoring period at Chhota Shigri Glacier.
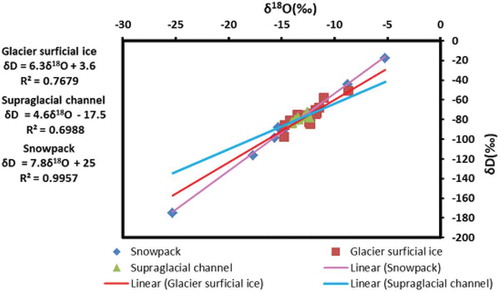
Table 3. Parameters of the linear relationship between δ18O and δD for all types of end members (Chhota Shigri Glacier).
Table 4. Detailed summary of discharge data for stable isotopes and electrical conductivity during study period.
Table 5. Parameters of the linear relationship between δ18O and δD for all stream water (Chhota Shigri Glacier).
Table 6. Statistical description of the tracers describing potential end members of stream water. SD: standard deviation.
Figure 6. Rainfall–runoff characteristics the during ablation season at Chhota Shigri Glacier stream.
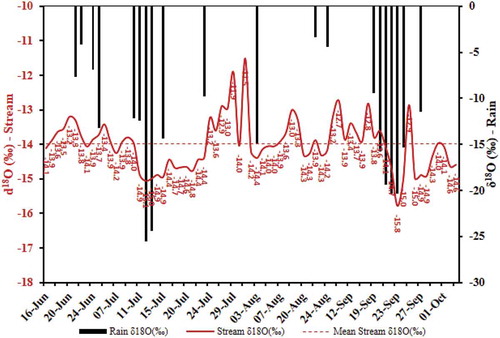
Figure 7. Mixing plot between δ18O (‰) and EC (µS/cm) of end members including average values of samples collected twice daily from main stream (morning: 08:00 h; evening: 18:00 h) during peak ablation.
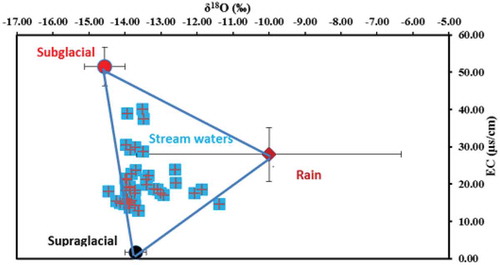
Figure 8. Monthly variation of (a) morning δ18O (‰), (b) evening δ18O (‰), (c) morning EC (µS/cm), and (d) evening EC (µS/cm) in the glacier stream. The whiskers represents the 10th and 90th percentiles, while the box limits indicate the 25th and 75th percentiles and the line inside the box represents the median.
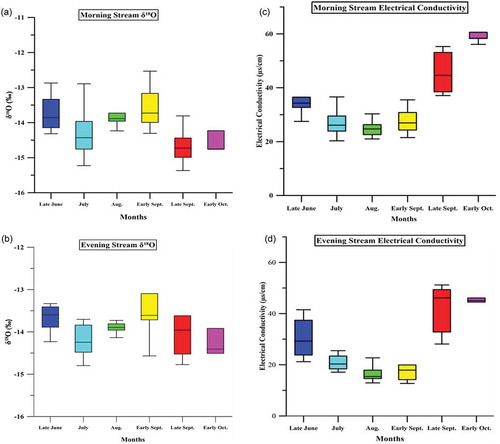
Figure 9. Temporal dynamics and comparison of monthly average values of tracers δ18O and EC in stream discharge samples taken consistently daily (morning: 08:00 h; evening: 18:00 h).
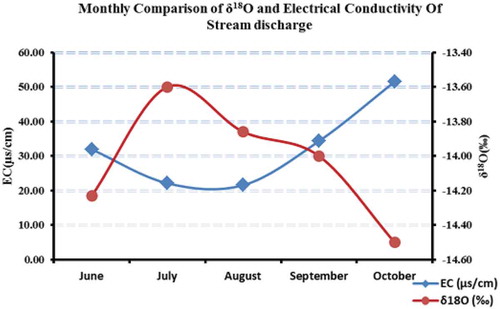
Table 7. Statistical differences among potential end members on the basis of tracers (δ18O and EC) performed with parametric t-test significant at α = 0.05.
Table 8. Previous studies that account for stable isotopes in hydrograph separation.
Table 9. Average (peak ablation) glacial end member (supraglacial and subglacial) contributions to glacial discharge based on tracer (δ18O and EC) data. The uncertainty is computed according to a Gaussian error propagation technique (Liu et al. Citation2004).