
Figures & data
Figure 1. Punitaqui Basin area.
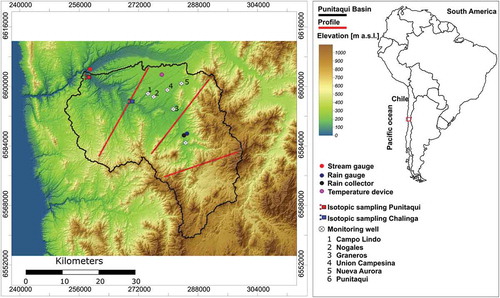
Figure 2. Conceptual representation of MBR (curved blue dashed arrows) for the Punitaqui Basin based on three transverse profiles of the study area (depicted in ). The vertical green arrow indicates the location of the Punitaqui Stream.
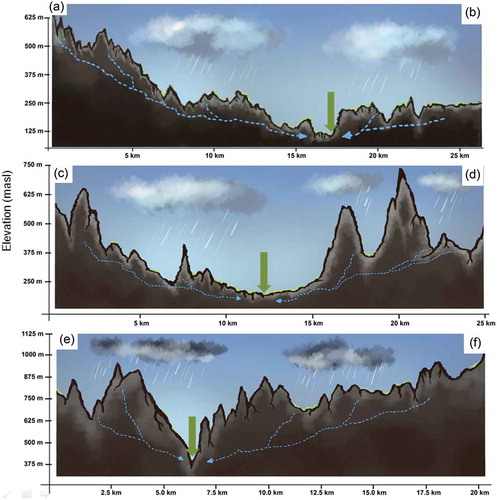
Table 1. Rain and flow gauging stations in the Punitaqui Stream basin and data availability.
Figure 3. Flow diagram of the algorithm used for the MTM method.
Figure 4. Monthly total precipitation and discharge in the study area.
Figure 5. Temporal evolution of monthly precipitation and average monthly discharge in the Punitaqui Basin.
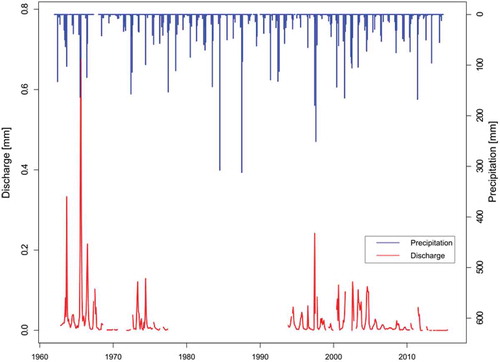
Figure 6. Values of 2H, 18O and 222Rn for the Punitaqui Stream at (a) Chalinga and (b) Desembocadura in the 2016–2017 period.
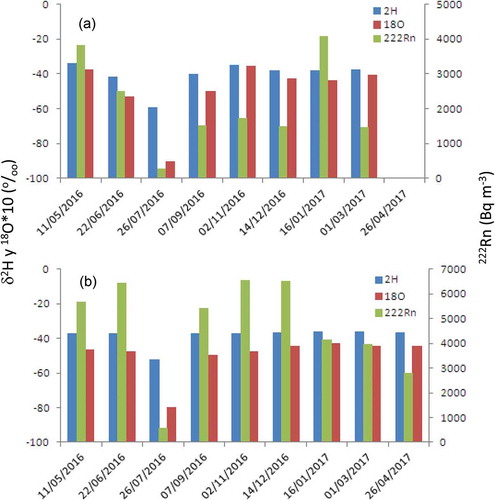
Table 2. Cultivated surface area of each basin according to various GIS layers.
Table 3. Weighted parameter values used in the modified Thornthwaite-Mather water balance.
Table 4. Summary of hydrological variables considered in the water balance. P: precipitation, Qr: runoff, ETP: potential evapotranspiration, ETr: real evapotranspiration, MBR: recharge. SD: standard deviation; CV: coefficient of variation.
Figure 7. Q* vs −dQ/dt relationship (blue dots), and bins (orange dots) determined using (a) the equal interval method and (b) the quantile method.
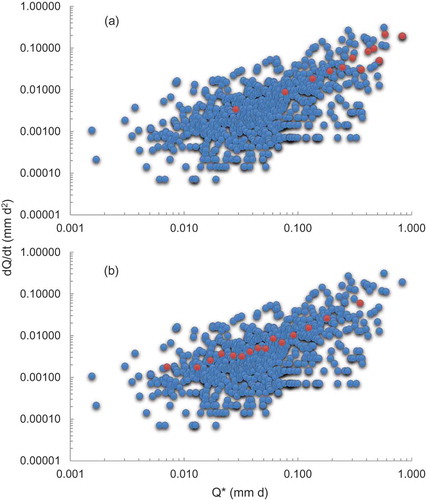
Figure 8. Temporal evolution (± standard deviation) of the average water table levels (lowest annual value) from the six DGA monitoring wells in the Punitaqui Stream basin.
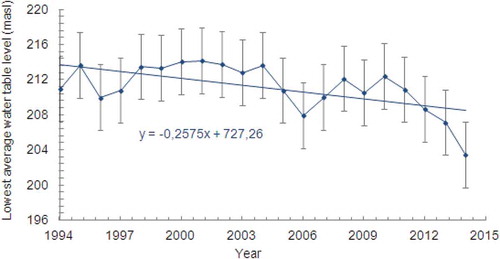
Table 5. Linear and polynomial regression coefficients for the quantile and equal interval methods.
Table 6. Hydrological year period MBR estimates, with maximum and minimum discharge each year, using the equal interval (EI) and quantile (QU) bin grouping methods. Dates (columns 4 and 6) in the form dd/mm.