
Figures & data
Figure 1. (a) Map of the study area showing the scanning area of the CINRAD-SA radar and (b) Qinhuai River Basin and streamflow stations with rainfall and flow gauges.
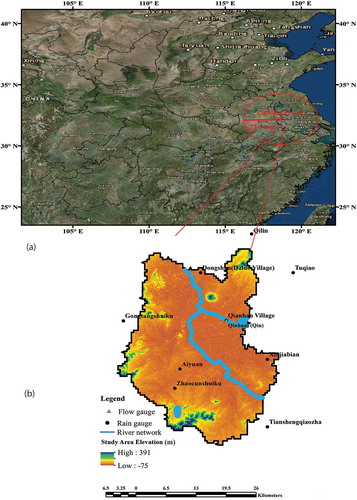
Table 1. S-band radar (CINRAD-SA) parameters.
Table 2. Remotely sensed satellite and re-analysis data used in this study.
Table 3. PDM parameter values for the Qinhuai River Basin.
Figure 2. Model calibration and validation flow results of (a) calibration (12 July 2010–20 June 2011) and (b) validation (12 July 2012–20 June 2013) of the PDM model for the Qinhuai River Basin catchment.
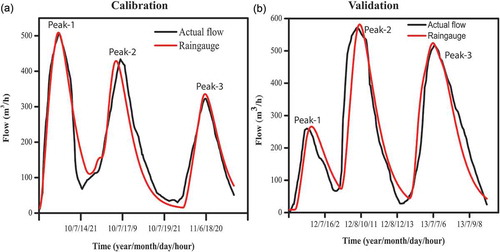
Table 4. Statistical indicators for calibration and validation using actual flow and raingauge data.
Table 5. Flood events analysed and highest peak flow for each event.
Table 6. Statistical parameters of rainfall estimates from satellite and radar data relative to raingauge data for the three study events.
Figure 3. Taylor diagrams showing correlation coefficients, standard deviations and unbiased root mean square differences (UbRMSD) between rainfall estimators C-MORPH (Cm), C_MORPHGC (CG), ERA-Interim (E), GPM (G), TRMM (T) and S-band radar (S) for Events 1, 2 and 3.
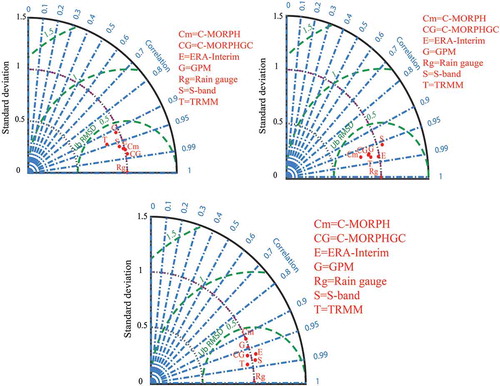
Figure 4. Comparisons of catchment cumulative rainfall from raingauge, C-morph, CMORPHGC, ERA-Interim (ERA), GPM, TRMM and S-band radar for Events 1, 2 and 3.
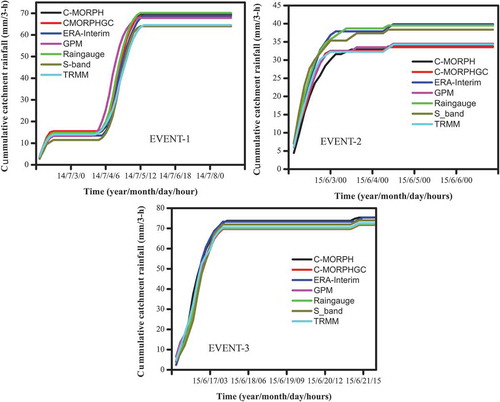
Figure 5. Comparisons of 3-h average catchment rainfall from raingauge, CMORPH, CMORPHGC, Era-Interim (ERA), GPM, TRMM and S-band radar for Events 1, 2 and 3.
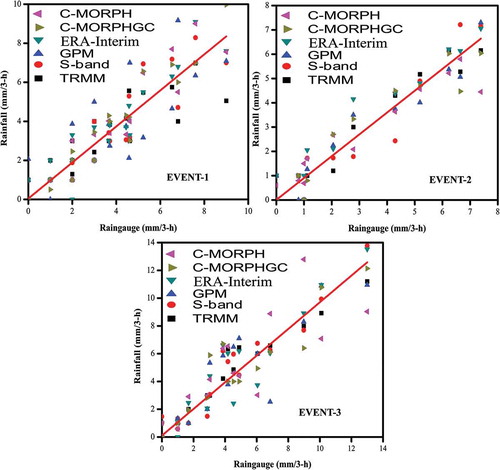
Figure 6. Comparison of computed and observed 3-h resolution flow for the Qinhuai River Basin for Events 1, 2 and 3. See caption for explanation of abbreviations.
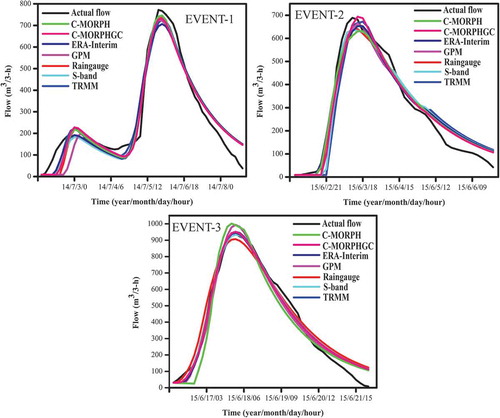
Table 7. Performance indicators of flow comparing raingauge data and CMORPH, CMORPHGC, ERA-Interim, GPM, TRMM and S-band radar data for the three study events.