Figures & data
Figure 1. (a) Paraná River Basin, climate gauges and seasonality index along the basin. The two black squares indicate the Itaipu Dam (in the south) and the city of Brasília (in the north, above gauge no. 7), used in the analysis of Sections 4.2 and 4.3; (b) detail of the Corumbá River Basin (dark blue drainage), used for the analysis in Section 4.5, showing Roncador gauge (red dot), used because of the full availability of daily relative air humidity and hours of sunlight data; (c) the 1424 unit-catchments used for model calculation; and (d) lithological regions used for model calibration
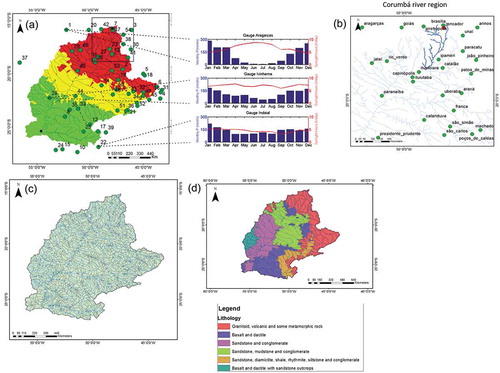
Table 1. Daily data availability (percentage of total period) of sunlight hours (SH), relative humidity (RH), atmospheric pressure (AP), wind speed (WS) and average surface air temperature (ST) for each of the 54 INMET gauges. The starting date (dd/mm/yyyy) of data availability for each gauge is also given; the ending date of 31/12/2011 is the same for all gauges
Figure 2. Overview of the methodology used, comparing the simulation scenarios with and without precipitation as proxy. RH: relative humidity; SH: sunlight hours; ST: surface average air temperature; WS: wind speed; AP: atmospheric pressure
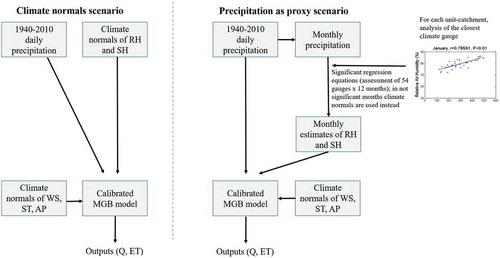
Figure 3. Correlation between climatological variables and monthly precipitation for gauges Aragarças and Indaial. The straight (blue) line refers to the linear regression. See for gauge locations
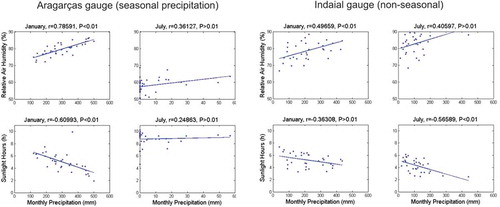
Figure 4. Box plots of p values for each month for the correlations between monthly precipitation and sunlight hours and relative humidity, based on a set of 54 p values (one for each climate gauge). Median values are displayed at the figure bottom
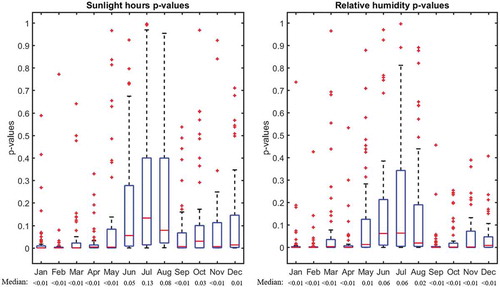
Table B1. Main statistics for the correlations between monthly sunlight hours and precipitation for the months January and July. Pearson correlation (r) and p value are presented for each gauge
Figure 5. Number of months of the year with p < 0.01 for each gauge for relative air humidity and sunlight hours
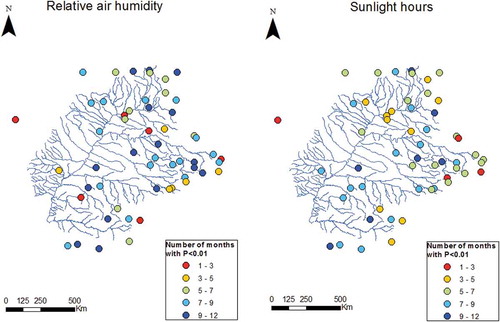
Figure 6. Daily relative air humidity and sunlight hours for Brasilia (north of the basin) and Itaipu Dam (southern region), as computed from precipitation as proxy or only from climate averages
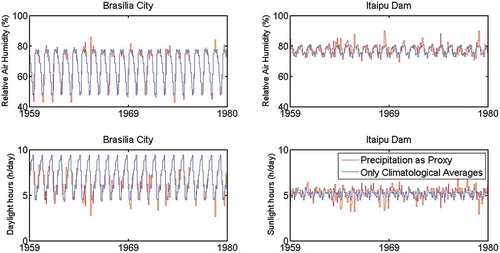
Figure 7. Monthly actual evapotranspiration (ET), with the two types of computation of climate variables, Precipitation as Proxy (ETproxy, blue) and Only Climatological Averages (ETnoproxy, red), and the difference between them (ETproxy − ETnoproxy, green), for Brasília city and Itaipu Dam, and monthly precipitation (P) for the same locations
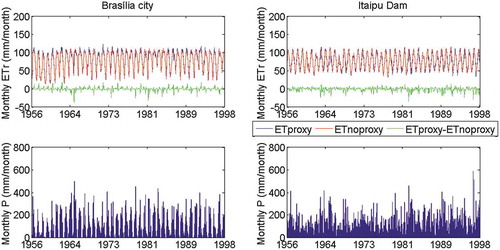
Figure 8. Relationship between monthly precipitation and simulated monthly evapotranspiration for Brasília City (northern region) for the simulation period 1940–2010
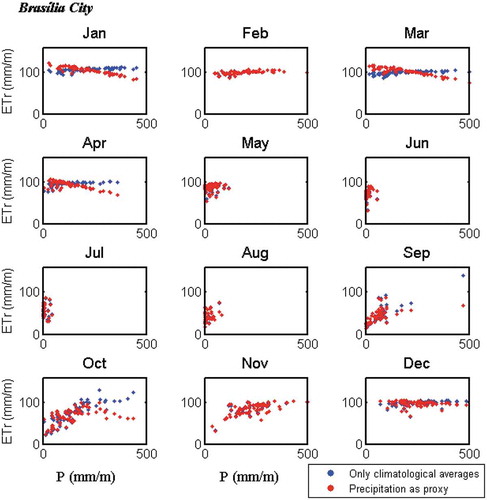
Figure 9. Relationship between monthly precipitation and simulated monthly evapotranspiration for Itaipu Dam (southern region) for the simulation period 1940–2010
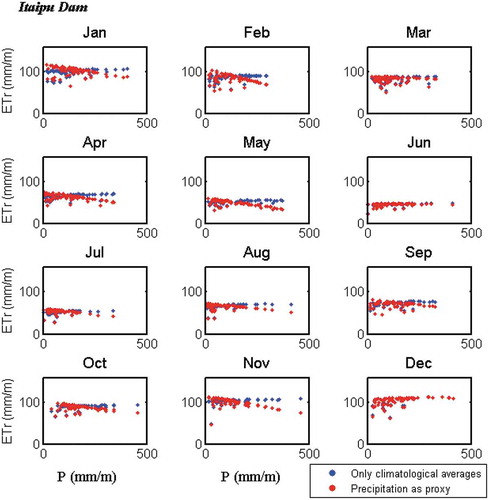
Figure 10. Long-term variation in calculated annual average discharge with and without precipitation as proxy. Horizontal lines indicate average values pre- and post-1973
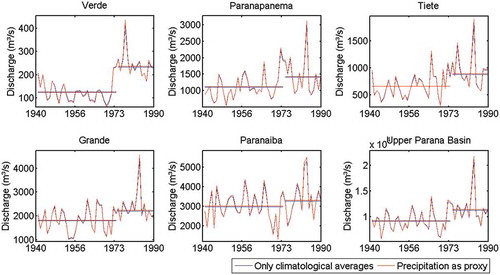
Figure 11. Long-term variation in calculated annual evapotranspiration with and without precipitation as proxy. Horizontal lines indicate average values pre- and post-1973
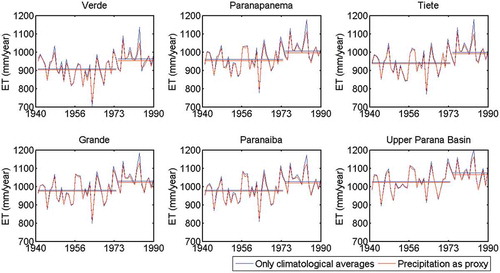
Figure 12. (a) Discharge at the Corumbá River sub-basin outlet for scenarios a–c; and (b) daily and (c) monthly evapotranspiration for the Corumbá River sub-basin. See ) for the sub-basin location
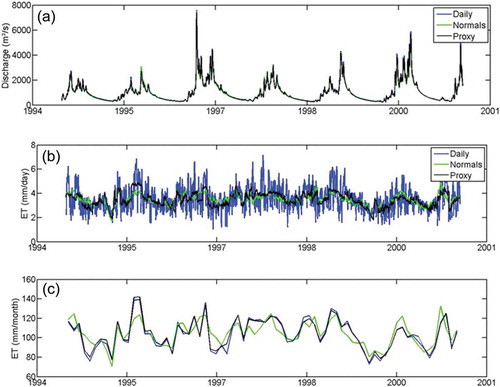
Table A1. Model calibrated parameters for rainfall–runoff processes: Wm: maximum water storage in the soil of each HRU; b: parameter from the variable contributing area model for runoff generation; Kbas and Kint: equivalent hydraulic conductivities for baseflow and subsurface flow;; and CS, CI and CB: related to residence time within surface, subsurface and baseflow linear reservoirs, respectively. The HRUs adopted in this study are: Forest_Deep: forest with deep soil; Forest_Shallow: forest with shallow soil; Agric_Shallow: agriculture with shallow soil; Agric_Deep: agriculture with deep soil; Grass_Shallow: grasslands with shallow soil; Grass_Deep: grasslands with deep soil; Floodplain: floodplain areas adjacent to rivers; and Urban: urban areas
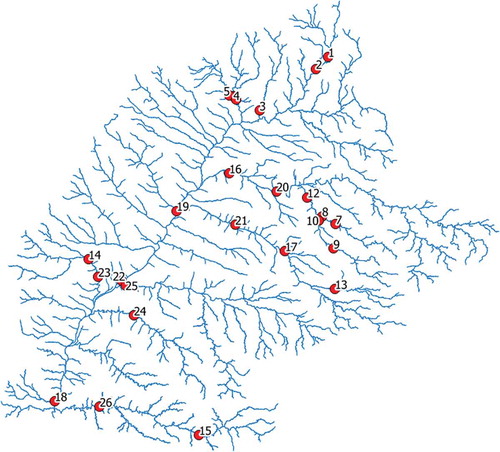
Table A2. Performance metrics (KGE) after model validation for the 26 gauges presented in
Figure A1. Discharge gauges used for model validation. KGE performance metrics are presented in