
Figures & data
Figure 1. Distribution of the studied river basins and main snow zones in the cryosphere areas of China. NWC, NEC and TP represent snow zones in Northwest China, Northeast China and the Tibetan Plateau, respectively. The numbers on the map represent the different river basins of the study. See for station/basin information.
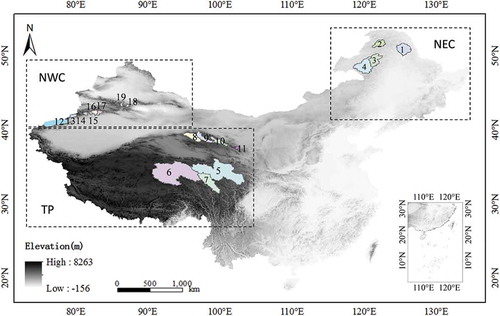
Figure 2. CSSD trends from 1979 to the 2010s in 19 river basins of the cryosphere areas of China. The significant increase/decrease denotes the trend of CSSD change for a basin is significant at p ≤ 0.1. CSSD is the average snow depth from November to the following March.
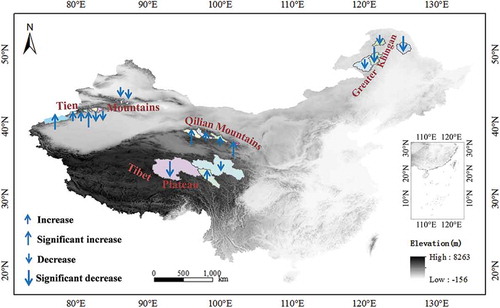
Figure 3. Spring runoff trends from 1979 to the 2010s in the 19 river basins in the cryosphere areas of China. The significant increase/decrease denotes the trend of spring runoff change for a basin is significant at p ≤ 0.1. Spring runoff refers to the average runoff during the period from March to May.
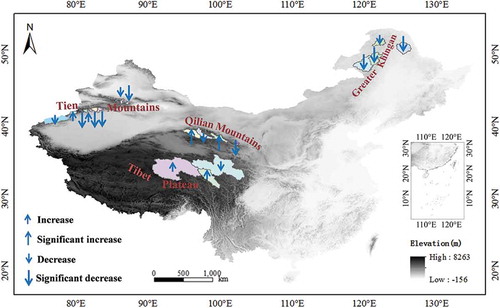
Figure 4. Snowmelt runoff changes in the main cryosphere watershed of the Northern Hemisphere, for the basins of the Lena, Yenisei and Ob rivers (Yang et al. Citation2003), the Syr Darya, Amu Darya, Indus, Ganges, Brahmaputra and Mekong rivers (Savoskul and Smakhtin Citation2013), the Colorado River (Painter et al. Citation2010), the Rhine River (Junghans et al. Citation2011) and the Tarim, Yangtze, Yellow and Hailar rivers (our study).
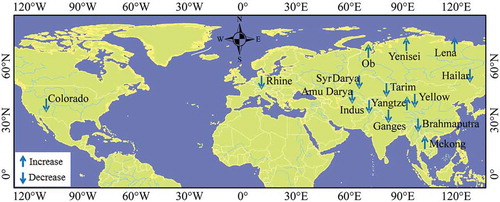
Figure 5. Changes in the index – dividing the runoff for a month (m3/s) by the CSSD (cm) – for (a) March and (b) May in the cryosphere areas of China.
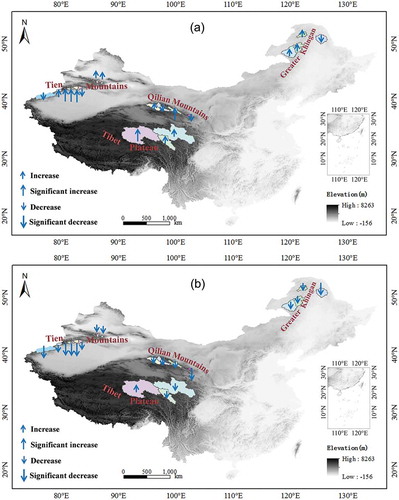
Table 1. Studied river basins in the cryosphere areas of China. Snow zones are NWC: Northwest China; NEC: Northeast China; and TP: Tibetan Plateau.
Table 2. Parameters of passive microwave sensors on various satellitesa.
Table 3. Change trends in CSSD and spring runoff in the cryosphere areas of China. CSSD denotes cold season snow depth from November to March of the following year. CSSD change and runoff change were estimated by the Mann-Kendall test. Italic, bold and underlined values indicate statistical significance of p ≤ 0.1, p ≤ 0.05 and p ≤ 0.01, respectively. See for station/basin information.
Table 4. Correlation analysis between CSSD and the runoff during spring. CSSD denotes snow depth from November to March of the following year. Italic, bold and underlined values indicate statistical significance of p ≤ 0.1, p ≤ 0.05 and p ≤ 0.01, respectively. See for station/basin information.