
Figures & data
Figure 1. Locations of the stations used in the study.
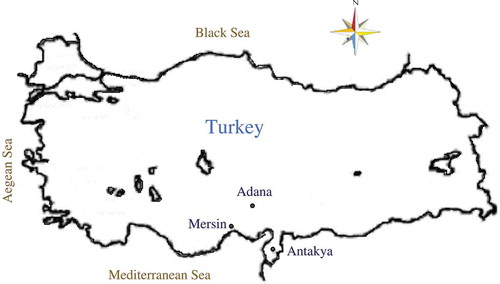
Figure 2. Structure of the MARS model (after Deo et al. Citation2017).
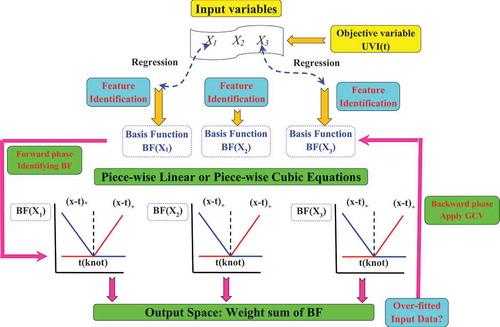
Figure 3. Structure of the M5Tree model (after Deo et al. Citation2017, Sanikhani et al. Citation2018).
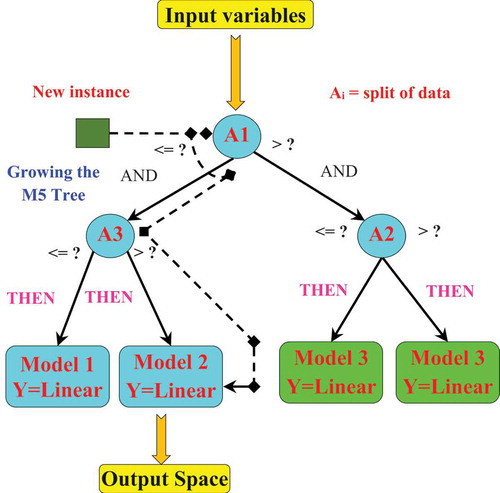
Figure 4. Observed and estimated Epan by the MARS, M5Tree, CHS, SS and MLR methods in the test period – Adana station.
Table 1. Statistical parameters of climatic data used in the study. Tmin: minimum temperature; Tmax: maximum temperature; Ra: extraterrestrial radiation; Epan: pan evaporation. xmin, xmax, xmean, Sx and Csx are minimum, maximum, mean, standard deviation and skewness, respectively.
Table 2. Error statistics of various input combinations and data-splitting strategies – Adana station. Tmin, Tmax, Ra and α are minimum and maximum temperatures, extraterrestrial radiation and periodicity (month number), respectively. RMSE, MAE and NSE are root mean square error, mean absolute error and efficiency coefficient, respectively. Bold values indicate the best performance. See Appendix for results of the other two stations.
Table 3. Error statistics of each model for different data-splitting strategies – Adana station. See for explanation of abbreviations and variables.
Table 4. Regression tree of the MARS model in the test phase under the 75%–25% train-test scenario – Adana station.
Table 5. Regression tree of the M5Tree model in the test phase under the 75%–25% train-test scenario – Adana station.
Figure A1. Observed and estimated Epan by the MARS, M5tree, CHS, SS and MLR methods in the test period – Antakya station.
Figure A2. Observed and estimated Epan by the MARS, M5tree, CHS, SS and MLR methods in the test period – Mersin station.
Table A1. Error statistics of various input combinations and data-splitting strategies – Antakya station. Tmin, Tmax, Ra and α are minimum and maximum temperatures, extraterrestrial radiation, and periodicity (month number), respectively. RMSE, MAE and NSE are root mean square error, mean absolute error and efficiency coefficient, respectively. Bold values indicate the best performance.
Table A2. Error statistics of each model for different data splitting strategies – Antakya station. See for explanation of abbreviations and variables.
Table A3. Regression tree of the MARS model in the test phase under the 75%–25% train-test scenario – Antakya station.
Table A4. Regression tree of the M5Tree model in the test phase under the 75%–25% train-test scenario – Antakya station.
Table A5. Error statistics of various input combinations and data-splitting strategies – Mersin station. See for explanation of abbreviations and variables. Bold values indicate the best performance.
Table A6. Error statistics of each model for different data-splitting strategies – Mersin station. See for explanation of abbreviations and variables.
Table A7. Regression tree of the MARS model in the test phase under the 75%–25% train-test scenario – Mersin station.
Table A8. Regression tree of the M5Tree model in the test phase under the 75%–25% train-test scenario – Mersin station.