Figures & data
Figure 1. Map of the Dugar Gad headwater catchments showing the locations of raingauges and stream gauging sites, as well as the investigated spring and seeps (K1, K2 and K3) within the representative elementary watershed (REW).
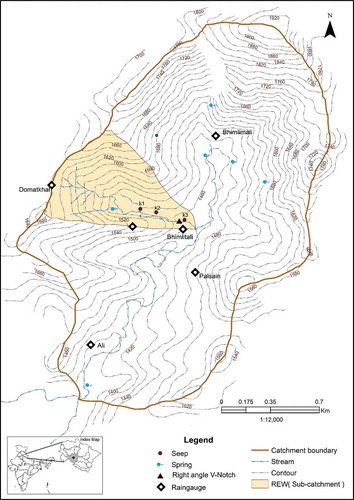
Figure 2. (a) Simplified geological map of the study area showing the strike and dip direction of dominant lithological strata. The background satellite image of IRS-P6 LISS-IV was taken in May 2008. The two inset photographs show: (bottom right) the typical sequence of soil, saprolite, lightly weathered rock and fresh rock (quartzite); and (top left) phyllites interbedded with quartzites, with steeply inclined schistosity and fractures that may act as preferential flow paths. (b) Geological cross-section along the A–A′ transect of showing interbedded quartzite and phyllite lithology and dominant dip direction of bedrock (NE) as indicated by the rose diagram. Location of spring outflow point indicated by the (blue) dot.
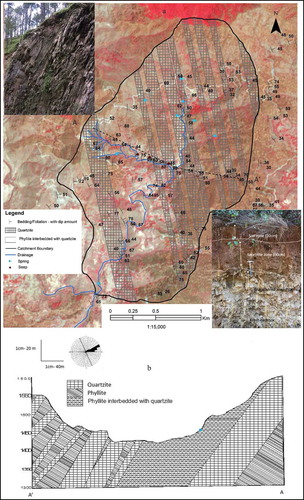
Table 1. Summary of stable isotope signatures (δ18O and δ2H) at Dugar Gad in rainfall, stream water and spring water in 2010 and 2011. n denotes the number of samples. Monsoon: mid-June to mid-September; pre-monsoon: March to mid-June. Min: minimum; Max: maximum.
Figure 3. Temporal variation of (a) rainfall amount, (b) stable isotope content (δ18O), and (c) d-excess values in precipitation at Palsain station (1454 m a.m.s.l.) based on event sampling during the monsoon period of 2010 and year-round (March–December) sampling in 2011.
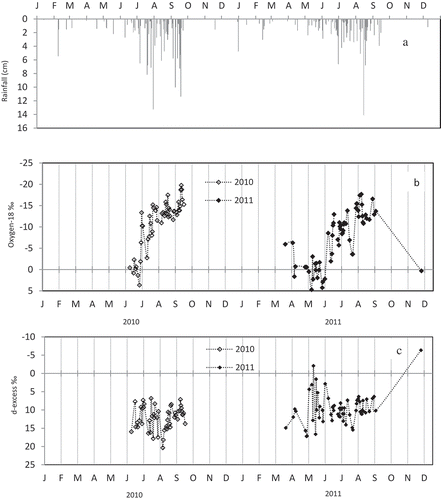
Figure 4. Variation in δ18O and δ2H contents in rainfall at Dugar Gad for the monsoon periods of 2010 and 2011 as well as the non-monsoon period of 2011. The local meteoric water line (LMWL) is shown for the monsoon of 2011 along with the weighted mean isotopic values for annual, monsoon and non-monsoon rainfall, as well as the mean annual values for spring and stream water in the REW in 2011. The region demarcated by the dotted line represents the dominant monsoonal isotopic signature, and that by the continuous line the dominant non-monsoonal isotopic signature.
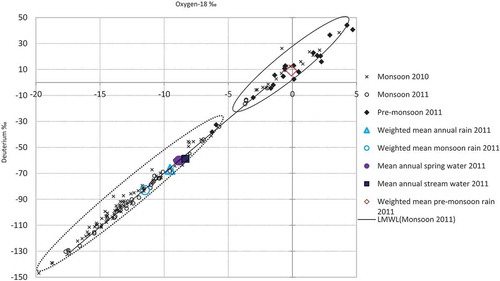
Figure 5. Temporal variability of (a) rainfall, spring and stream discharge in the REW, (b) stable isotope content (δ18O) of spring flow (green line) and streamflow (blue line), and (c) electrical conductivity of spring and streamflow during the year 2011.
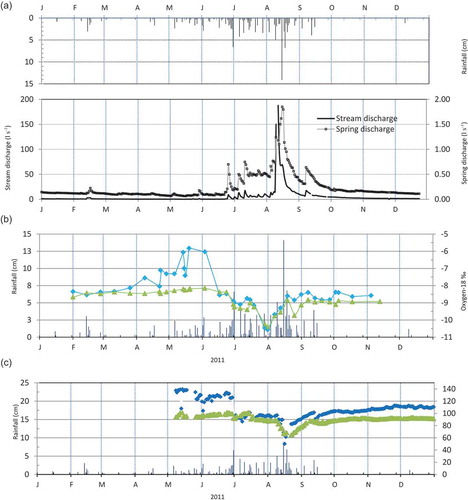
Figure 6. Plot of δ18O content versus d-excess values for monsoon and pre-monsoon rainfall at Dugar Gad for the year 2011. Solid circle indicates a single winter event sample.
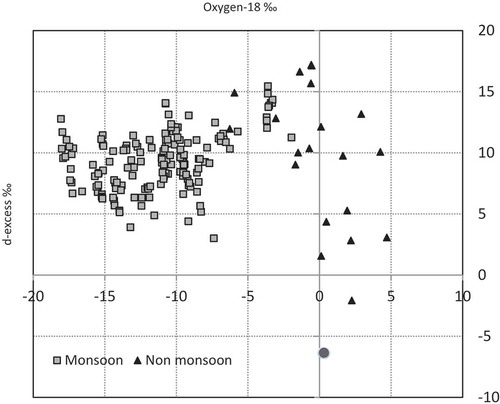
Figure 7. Plots of (a) spring discharge and (b) stream discharge against electrical conductivity, and (c) spring versus stream discharge (both in L s−1) for the REW during the rising and falling limbs of the seasonal hydrograph. Arrows indicate clockwise or counter-clockwise hysteresis.
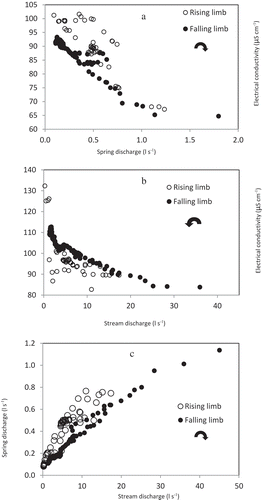
Figure 8. Time series of (a) electrical conductivity and (b) temperature of spring, stream and seepage (K1, K2 and K3) waters in the REW between mid-February and December 2012. Inset shows mean daily air temperature as measured at 1454 m a.m.s.l. (c) Plot of water temperature versus electrical conductivity of spring, stream and seepage (K1 and K2) waters.
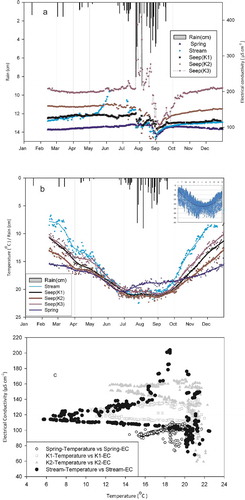
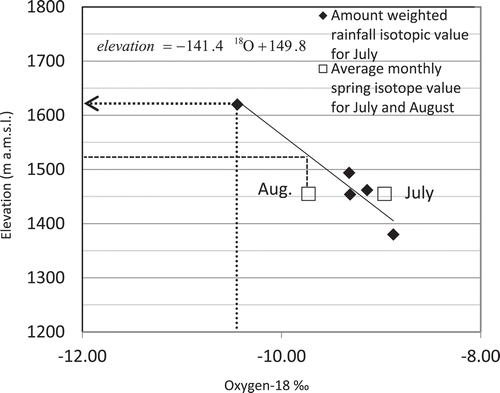
Figure 9. Derivation of the approximate groundwater recharge elevation at Dugar Gad (REW) based on the rate of decline with elevation of δ18O in precipitation in July 2011. Average monthly isotopic values of spring water are shown for July and August. Note that the value for July plots above the best-fit line due to the time lag between rainfall and spring discharge (see text for explanation). The arrow indicates the probable maximum recharge elevation.