Figures & data
Figure 1. Schematic view of (a) an M5 model tree (M5Tree) with six linear regression models, and (b) a multi-layer perceptron neural network (MLPNN).
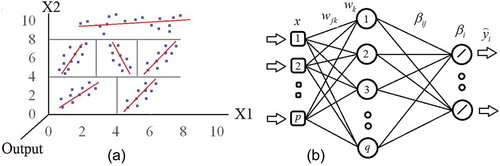
Figure 2. Location of the stations in the Mediterranean region of Turkey.
Table 1. Daily statistical parameters of each dataset. xmin, xmax, xmean, Sx and Csx denote minimum, maximum, mean, standard deviation and skewness, respectively.
Table 2. Comparison of statistical errors for PCE, RSM, M5Tree and MLPNN models for estimation of ET0 in the training stage – Isparta station.
Table 3. Comparison of statistical errors for PCE, RSM, M5Tree and MLPNN models for estimation of ET0 in the training stage – Antalya station.
Table 4. Comparison of statistical errors for PCE, RSM, M5Tree and MLPNN models for estimation of ET0 in the test stage – Isparta station.
Table 5. Comparison of statistical errors for PCE, RSM, M5Tree and MLPNN models for estimation of ET0 in the test stage – Antalya station.
Figure 3. Scatter plots of observed and different estimated ET0 models for Isparta station (top row) and Antalya station (bottom row) in the test period based on the input variable mean air temperature.
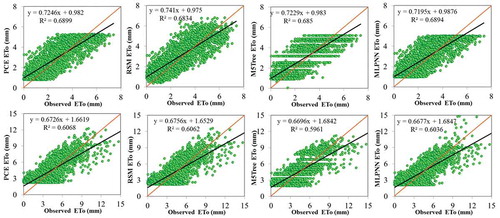
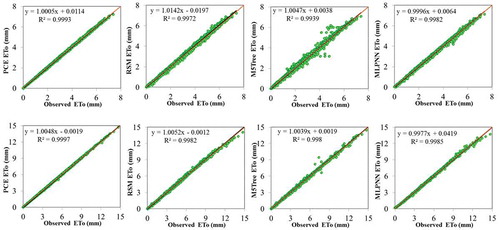
Figure 4. Scatter plots of observed and different estimated ET0 models for Isparta station (top row) and Antalya station (bottom row) in the test period based on the input variables mean air temperature and solar radiation.
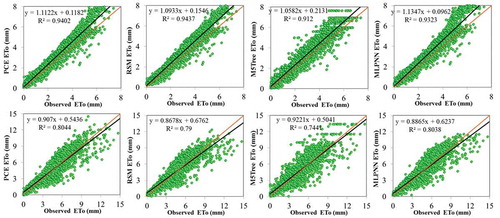
Figure 5. Scatter plots of observed and different estimated ET0 models for Isparta station (top row) and Antalya station (bottom row) in the test period based on the input variables mean air temperature, solar radiation and mean relative humidity.
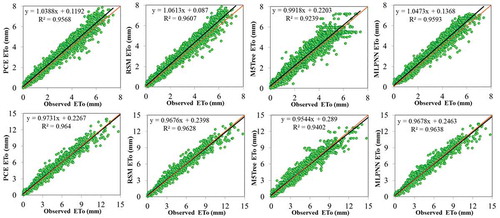
Figure 6. Scatter plots of observed and different estimated ET0 models for Isparta station (top row) and Antalya station (bottom row) in the test period based on the input variables mean air temperature, solar radiation, mean relative humidity and wind speed.