Figures & data
Figure 1. (a) The Carapelle catchment and (b) the Rio Cordon catchment, in Italy.
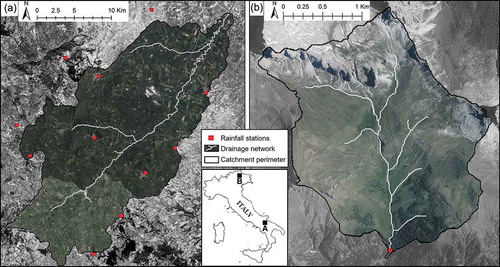
Table 1. Variables and units associated to the single hydrological events.
Figure 2. Graphical explanation of the studied variables. The acronyms of the variables are explained in .
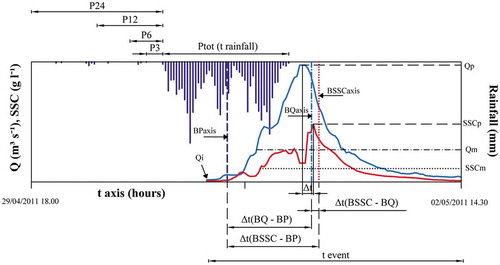
Table 2. Descriptive statistics resulting from the analyses of the single hydrological events and associated variables (see ). A total of 41 and 30 single floods were recorded, respectively, in the Carapelle and Rio Cordon watersheds. Min: minimum; Max: maximum; SD: standard deviation.
Table 3. Correlation matrix for the parameters analyzed in the forty-one Carapelle events (see ). The coefficients in bold are significant p-value < 0.01.
Figure 3. Comparison between the time lags of water discharge peak–suspended sediment concentration peak (∆t) and the corresponding time delays between sedigraph and hydrograph barycentres, ∆t(BSSC–BQ), recorded in the Carapelle and Rio Cordon catchments.
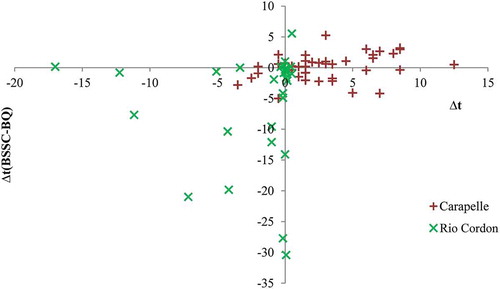
Table 4. Correlation matrix for the parameters analyzed in the thirty Rio Cordon events (see Table 1). The coefficients in bold are significant p-value < 0.01.
Figure 4. PCA for (a) the Carapelle catchment and (b) the Rio Cordon catchment. Component plot in rotated space. The variables are described in .
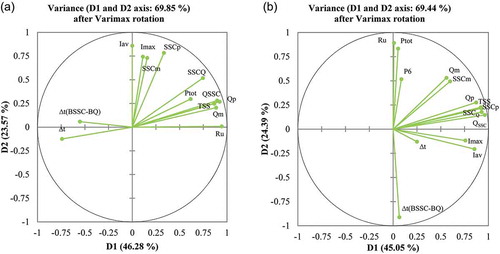
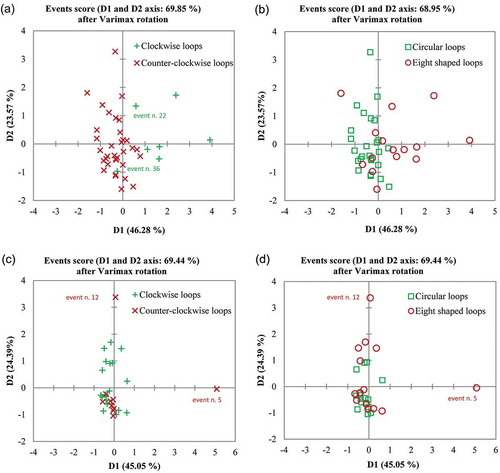
Figure 5. Event distributions in the factorial planes according to hysteresis directions and hysteresis shape in (a, b) the Carapelle catchment and (c, d) the Rio Cordon catchment.