Figures & data
Figure 1. Demonstration of increasing, decreasing and trendless areas according to Sen’s trend method on a Cartesian coordinate system.
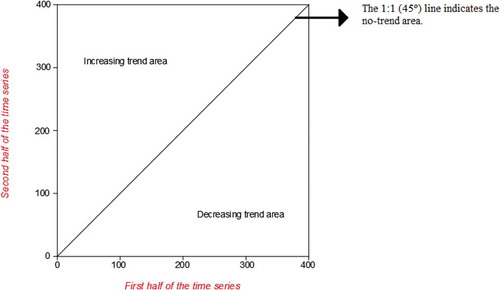
Table 1. Turkish river basins with selected gauging stations and their basic statistical characteristics.
Figure 2. Study area and spatial distribution of streamflow gauge stations used in the present study.
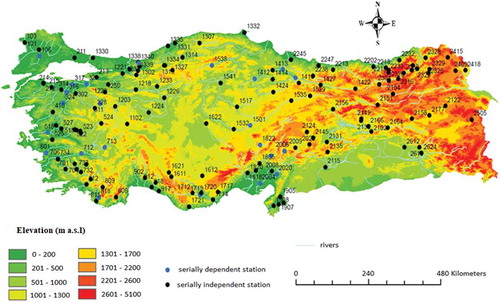
Figure 3. Map of median magnitudes of the AIMF series used in this study.
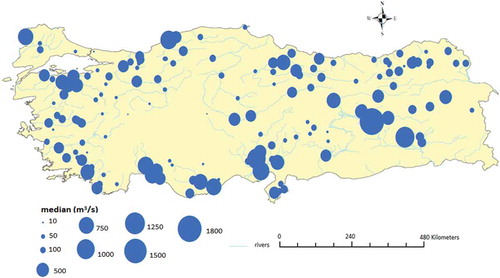
Table 2. The computed lag-1 autocorrelations, which are statistically significant, and the MK and SR test results (before and after the TFPW method).
Figure 4. Autocorrelation plots (before and after pre-whitening) of the AIMF series for selected stations.
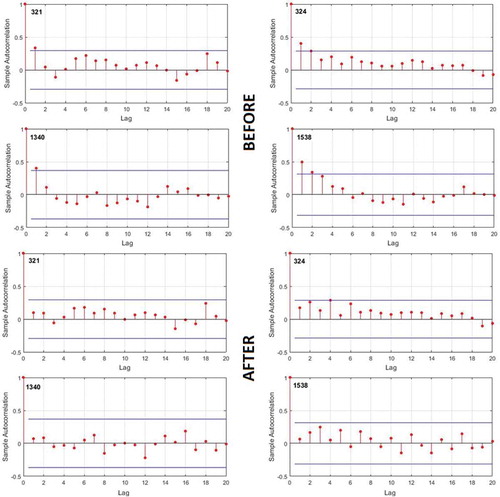
Figure 5. Spatial representation of the MK and SR trend test results with a significance level of 0.05 for the AIMF series.
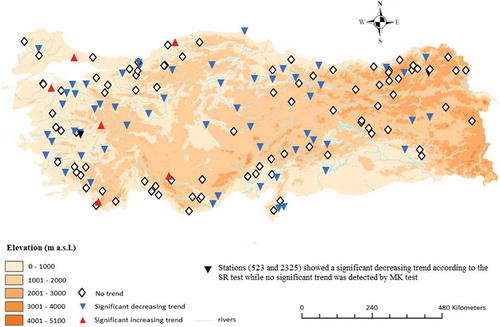
Figure 6. Spatial pattern of the trend magnitudes computed using Sen’s slope method.
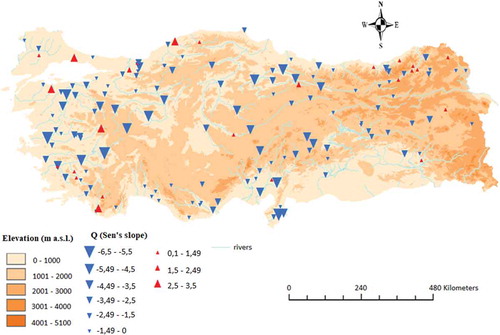
Table 3. Performance evaluation and comparison of the MK and Sen’s trend methods for all the stations in this study.
Figure 7. Results of Sen’s trend method for selected stations.
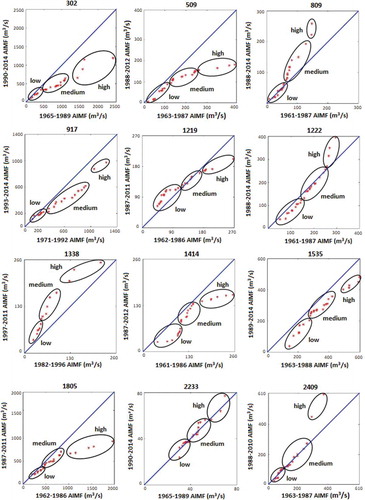
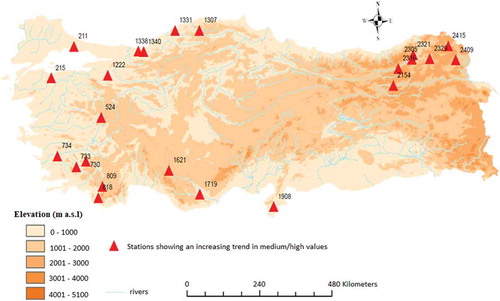
Figure 8. Spatial distribution of the increasing trends in medium or high clusters.