Figures & data
Table 1. River flow gauge stations used, listed from north to south, with upstream drainage area (km2), long-term maximum and minimum monthly mean discharge (m3 s−1), period of analysis and data source. SHR: Secretary of Hydric Resources of Argentina; GWD: General Water Directorate of Chile.
Figure 1. Geographical distribution of the river basins in the southern extreme of South America, and long-term monthly mean river flows (m3 s−1).
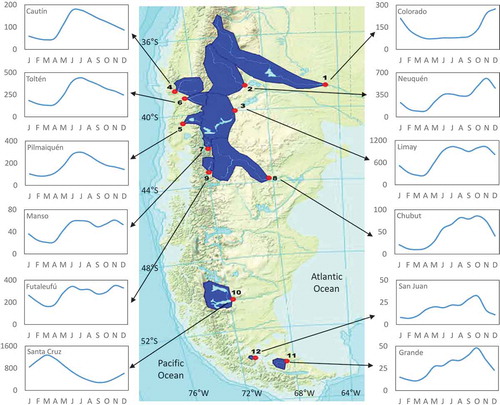
Figure 2. Oceanic Niño Index (ONI) average of El Niño (red) and La Niña (blue) events for the period 1950–2003. Values are 3-month running means of SST anomalies (°C) in the Niño3.4 region (5°N–5°S, 120°W–170°W), from February of the year when the ENSO event starts (o) until November of the following year (+).
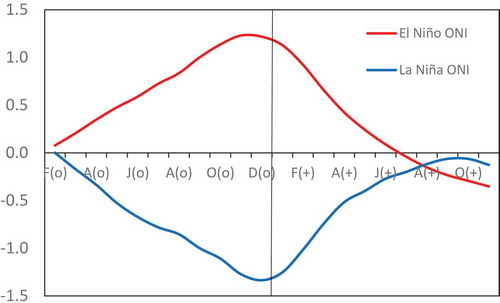
Table 2. List of warm (El Niño) and cold (La Niña) ENSO events considered in the study.
Figure 3. Monthly mean river flows (m3 s−1) of El Niño (red) and La Niña (blue) composites, and long-term monthly mean river flows (black), with geographical reference of the basins. The 24-month period runs from January of the year when the ENSO event starts (o) until December of the following year (+), both years separated by a vertical line.
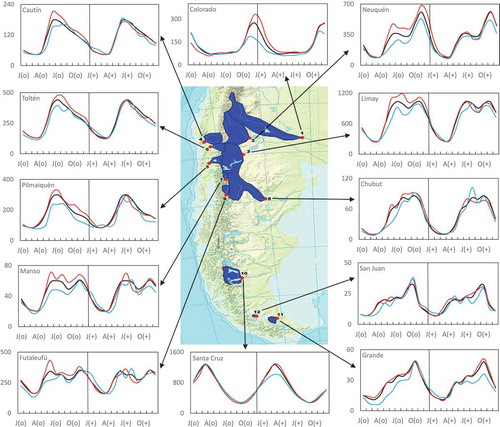
Table 3. Differences between El Niño and long-term monthly mean river flows. The red scale boxes ![]() indicate positive differences and the blue scale boxes
indicate positive differences and the blue scale boxes ![]() negative differences. The colour scale indicates that the result of Student’s t test of the difference in means is significant at 99%, 95% and <95% confidence levels, respectively. White boxes indicate no difference between monthly mean river flows. The vertical black line divides year(o) when the ENSO event begins and the following year(+). The rivers are listed from north to south and the horizontal thick lines separate groups of rivers (see text for the details).
negative differences. The colour scale indicates that the result of Student’s t test of the difference in means is significant at 99%, 95% and <95% confidence levels, respectively. White boxes indicate no difference between monthly mean river flows. The vertical black line divides year(o) when the ENSO event begins and the following year(+). The rivers are listed from north to south and the horizontal thick lines separate groups of rivers (see text for the details).
Table 4. Differences between La Niña and long-term monthly mean river flows. See for explanation.
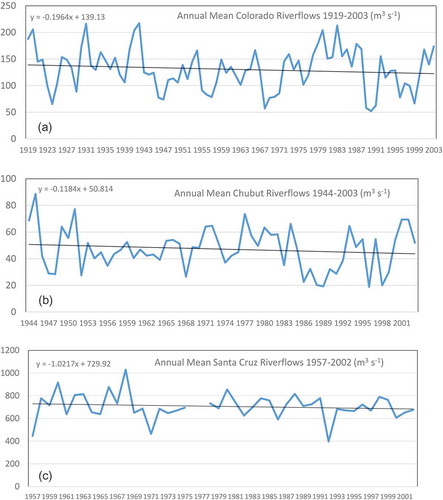
Figure 4. Time series of annual mean river flows (m3 s−1) of the (a) Colorado, (b) Chubut and (c) Santa Cruz rivers for the whole available period of each river.