Figures & data
Figure 1. Map of the Brazilian hydropower sector (NIS) basins studied.
Table 1. The CMIP5 models analysed in this study. The models are identified in some figures by the ID number in column 1.
Figure 2. Scheme of evaluation of the CMIP5 models for the period 1950–1999. All indexes are explained in the text.
Figure 3. Comparison between GPCC and CRU datasets of the basins in the NIS for (a) mean total annual rainfall and (b) coefficient of variation.
Figure 4. (a) Annual precipitation time series and (b) monthly precipitation climatology over São Luiz do Tapajós basin.
Figure 5. Climatology in terms of precipitation (1950–1999) from six CMIP5 global models and GPCC data (dashed line) for the Furnas, Itaipú, Sobradinho and Tucuruí basins. The models are chosen according to the AVALs criterion. The three best and three worst models are shown.
Table 2. Values of the proposed statistical indices for the evaluation of the CMIP5 models at the seasonal scale for the Brazilian electricity sector (NIS) basins. Bold values of the Pearson correlation coefficient (CORREL) are not significant at the 95% level.
Table 3. AVALs of the CMIP5 models tested for the Furnas, Itaipu, Sobradinho and Tucuruí basins.
Figure 6. Global wavelet spectrum of the best and worst CMIP5 models for Furnas, Itaipu, Sobradinho and Tucuruí basins in comparison with GPCC data. “o” indicates the best model, while “” indicates the worst;
is the observation data.
Table 4. Best and worst values obtained from the proposed statistical indexes for the seasonal CMIP5 models evaluation on a inter-annual scale, considering the Brazilian electricity sector basins. Bold values of Pearson’s Correlation coefficient are not significant at 95%.
Table 5. AVALi of the CMIP5 models for the Furnas, Itaipú, Sobradinho and Tucuruí basins.
Figure 7. Taylor diagrams for the Sobradinho, Tucuruí, Itaipu and Furnas hydrographic basins. The concentric arcs labelled REF represent the RMSE normalized by the standard deviation.
Figure 8. Total AVALg of the major basins in the Southeast/Midwest of the Brazilian electricity sector (NIS).
Figure 9. AVALg of the major basins in (a) the South, (b) the Northeast and (c) the North of the Brazilian electricity sector.
Figure 10. Impact on the average annual rainfall in the twentieth century for CMIP5 models with a RCP8.5 scenario in relation to the reference period (1984–2003) for (a) 2015–2044; (b) 2045–2074 and (c) 2075–2098. The models with AVALg below 0.2 were removed from this analysis.
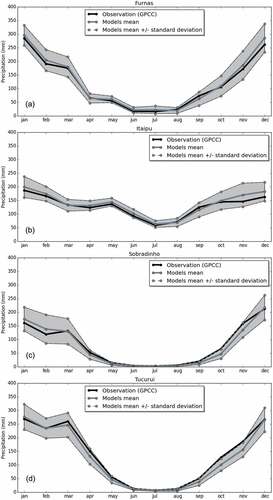
Figure 11. Seasonal projection (2070–2098 relative to 1984–2003) under the RCP8.5 scenario. The grey shaded area is computed by standard deviation anomaly of the models projected onto observational monthly precipitation for (a) Furnas, (b) Itaipú, (c) Sobradinho and (d) Tucuruí basins.