Figures & data
Figure 1. Study area.
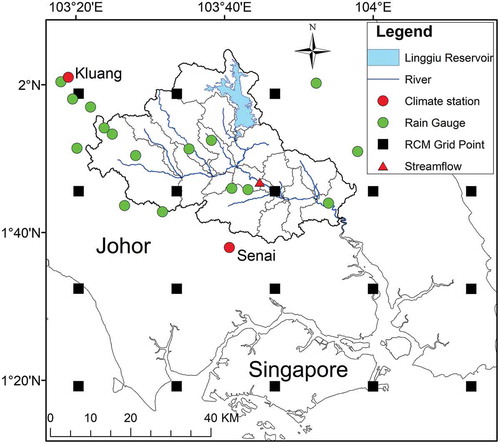
Table 1. Summary of climate projections. RCM: regional climate model.
Figure 2. Framework of the study.
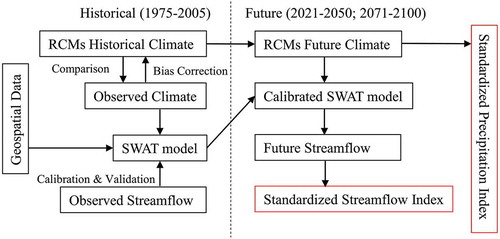
Table 2. Climate index classification.
Figure 3. Comparison of the climatology cycle between the RCMs and observed data under the (a) original precipitation, Pn; (b) original maximum temperature, Tx; (c) original minimum temperature, Tn; (d) bias-corrected precipitation, Pr_BC; (e) bias-corrected maximum temperature, Tx_BC; and (f) bias-corrected minimum temperature, Tn_BC for the period 1975–2005.
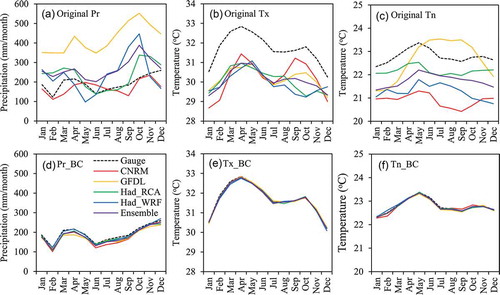
Figure 4. Mean absolute error (MAE) of the RCMs in simulating annual historical (a) precipitation (Pr), (b) maximum temperature (Tx) and (c) minimum temperature (Tn) at the Kluang (48672) and Senai (48679) stations.
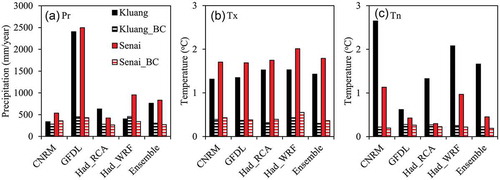
Table 3. Annual trends (changes per decade) of observed and RCM precipitation (Pr), maximum temperature (Tx) and minimum temperature (Tn) for the period 1975–2005 at the Kluang (48672) and Senai (48679) stations. MK: Mann-Kendall test; Sen: Sen’s slope. Bold indicates significance at p = 0.05.
Table 4. SWAT sensitivity analysis and calibration. Parameters are sorted from most sensitive (no. 1) to least sensitive (no. 12). V_ indicates that the original parameter value is replaced by a value, while R_ indicates that the original parameter is multiplied by (1 + a given value).
Figure 5. Comparison of monthly observed and simulated SWAT for calibration (1976–1985) and validation (1986–1989) periods.
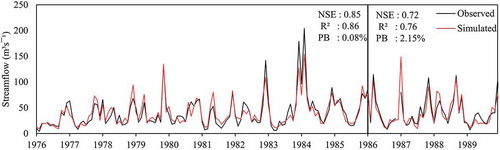
Figure 6. Changes in annual precipitation, and maximum and minimum temperatures under (a) RCP4.5 and (b) RCP8.5 scenarios against the historical mean (1976–2005).
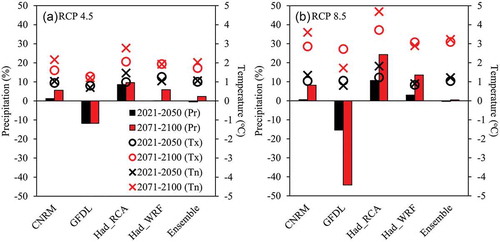
Figure 7. Monthly changes in precipitation, and maximum and minimum temperatures under the RCP4.5 and RCP8.5 scenarios for the 2021–2050 and 2071–2100 periods against the 1976–2005 historical period. The shading indicates the ensemble range by all climate projections.
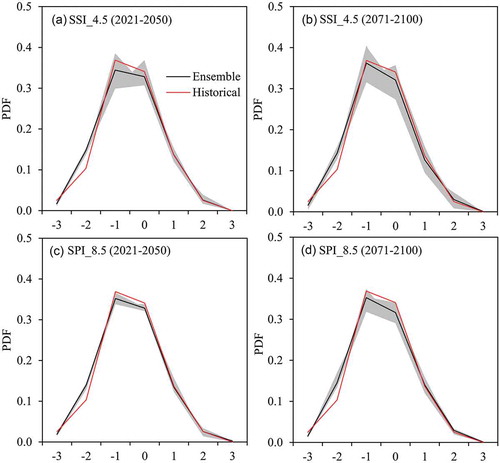
Figure 8. Probability density function (pdf) of the historical (1976–2005) and future (2021–2050 and 2071–2100) SPI-3 under the (a,b) RCP4.5 and (c,d) RCP8.5 scenarios.
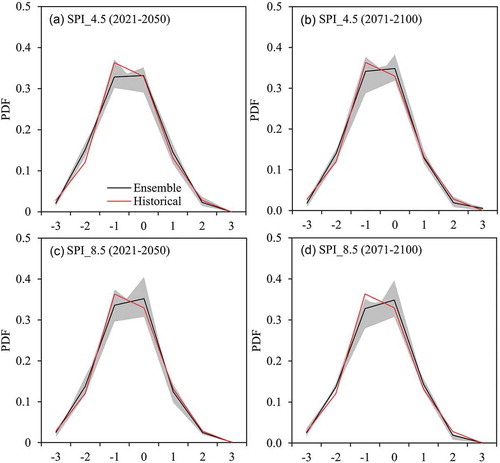
Figure 9. Comparison of the number and duration of the historical and future (a,c) meteorological and (b,d) hydrological droughts of the JRB under the RCP4.5 and RCP8.5 scenarios.
Figure 10. Relative changes in the future annual streamflow against the historical period under various climate projections and RCP scenarios.
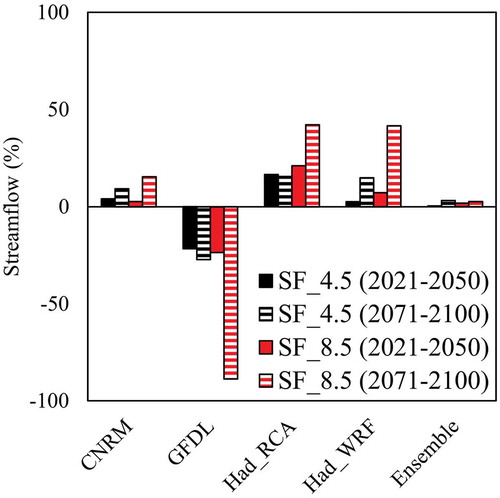
Figure 11. Probability density function (pdf) of the historical (1976–2005) and future (2021–2050 and 2071–2100) SSI-3 under the (a,b) RCP4.5 and (c,d) RCP8.5 scenarios.