
Figures & data
Figure 1. Location information for the Taihu Basin and Tianmu sub-basin.
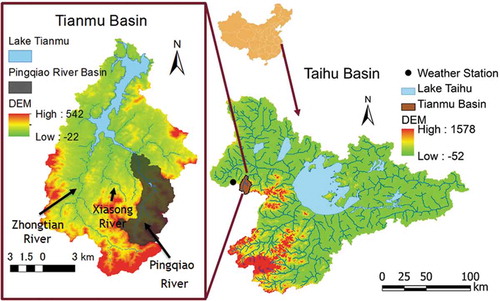
Figure 2. Topographical (DEM: digital elevation model) and land-use information of the Pingqiao River Basin.
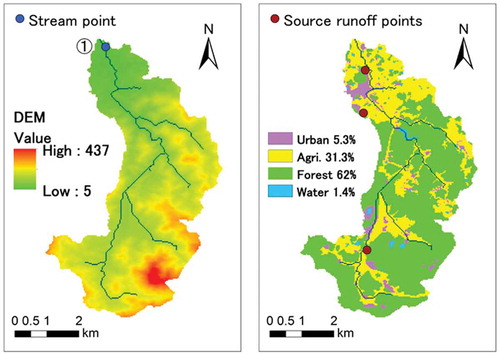
Figure 3. Schematic diagram of NPS pollution model mechanism and process.
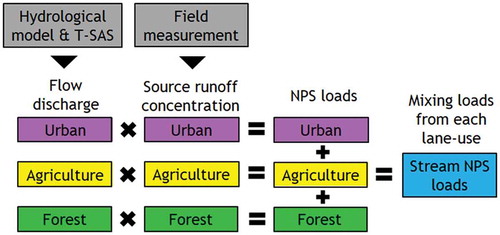
Figure 4. Schematic diagram of surface/subsurface flow conditions of the RRI model (Sayama Citation2011).
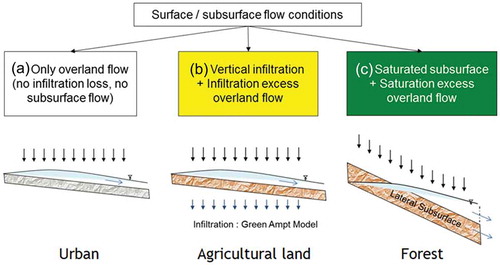
Figure 5. Schematic diagram of the hydrograph separation by spatial sources of rainwater. Source: Sayama and McDonnell (Citation2009). See text for explanation.
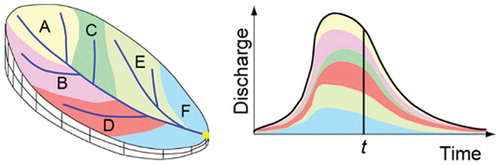
Figure 6. Schematic diagram of storage water separation by the RRI model and the T-SAS.
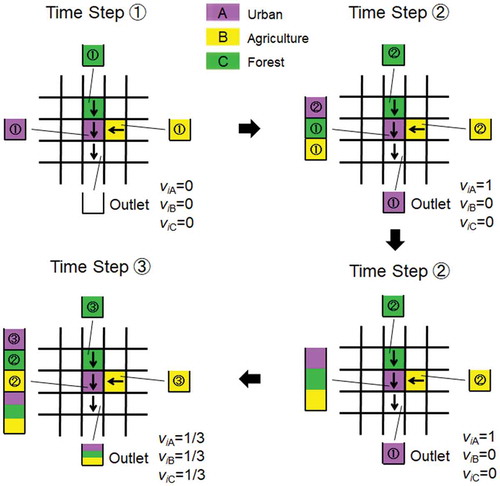
Figure 7. Hydrograph-separation results at Point ①, using the T-SAS.
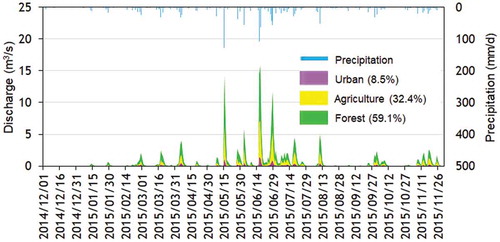
Figure 8. Observed source runoff concentrations for the different land-use types studied.
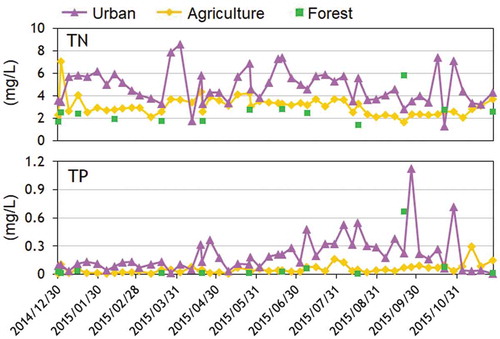
Figure 9. Stream NPS nutrient concentration simulation and validation.
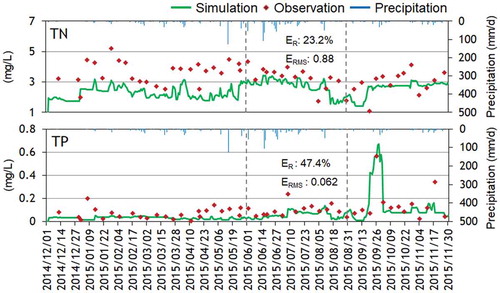
Figure 10. Long-term simulation of the NPS nutrient loads.
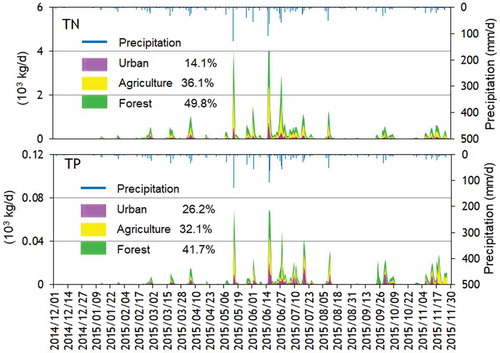
Figure 11. Summary of the temporal and spatial contributions of the NPS nutrients.
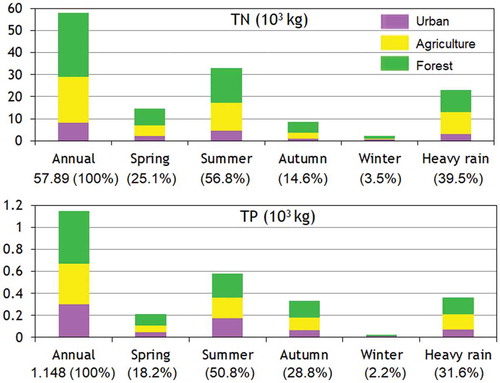
Table 1. Summary of simulation results separated by land use.