
Figures & data
Table 1. Basic information of remote sensing images.
Figure 1. Map of the Xiaoqing River Basin above Huangtai Station with the location of rainfall and hydrological stations.
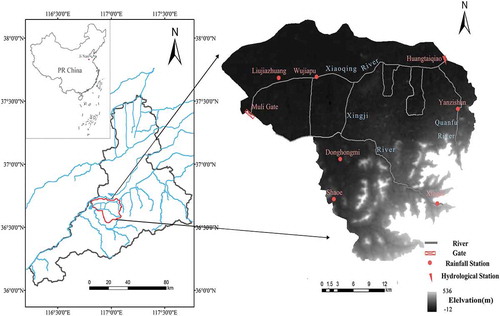
Figure 2. Variation of the annual average (a) precipitation and (b) discharge of the Xiaoqing River basin above the Huangtai hydrological station from 1970 to 2016.
Figure 3. Land-use types of the Xiaoqing River basin above the Huangtai hydrological station in typical years.
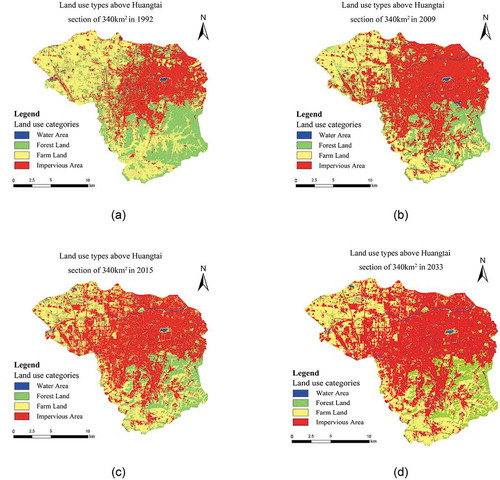
Figure 4. The ratio of impervious area of the Xiaoqing River basin above the Huangtai hydrological station (1970–2016).
Table 2. Identification of the trend and change points of univariate distribution of the Xiaoqing River basin above the Huangtai hydrological station in the period 1970–2016. ↑ and ↓denote an increasing or decreasing trend; + and – represent a significant and insignificant trend, respectively.
Table 3. Parameter values and test results of multivariable copula functions, Clayton, Gumbel-Hougaard (GH) and Frank. RMSE: root mean square error; K-S: Kolmogorov-Smirnov test. Bold denotes the minimum RMSE and K-S, and the best fitness parameter.
Figure 5. Contour plots and surface of bivariate and trivariate joint probability distribution for the period 1970–2016. Bivariate joint probability of: (a) set (P,Q); (b) set (CA,Q); (c) set (CA,P); and (d) trivariate joint probability of set (CA,P,Q).
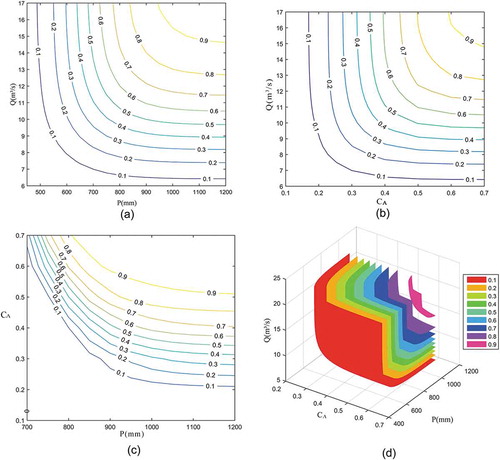
Table 4. Change points and tail-dependence of two- and three-variable parameter sets.
Figure 6. Analysis of the combined change points based on two- or three-variable sets: (a) pair (P,Q); (b) pair (CA,Q); (c) pair (CA,P); and (d) set (CA,P,Q).
Table 5. Selected copulas and their parameters before and after the combined change point. G-H: Gumbel-Hougaard, AMH: Ali-Mikhail-Haq.
Figure 7. Contour plots of PVW(v,w) probability: (a) with all the data of 1970–2016; (b) before the change point (1970–2000); and (c) after the change point (2000–2016).
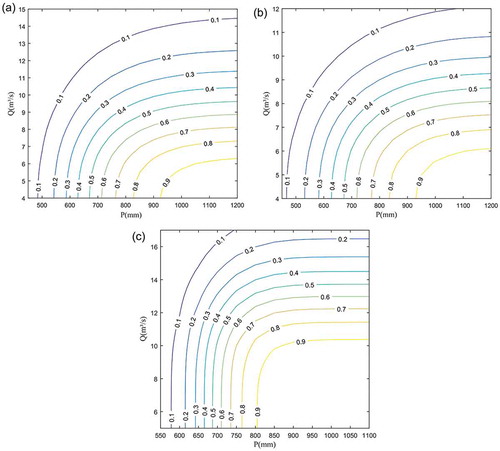
Figure 8. Contour surface plots of PUVW(u,v,w) probability: (a) with all the data of 1970–2016; (b) before the change point (1970–2007); and (c) after the change point (2007–2016).
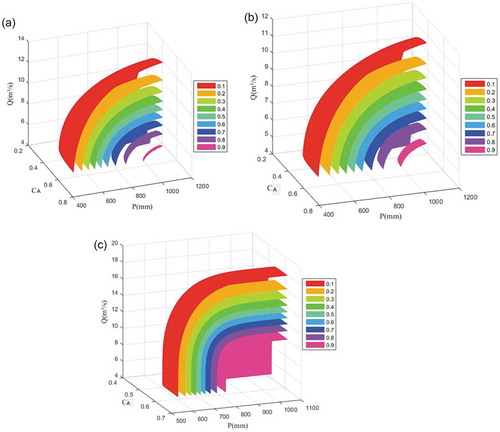
Table 6. Joint probability of (P,Q).
Table 7. Joint probability of (P,CA,Q).