
Figures & data
Figure 1. Study area: the seven hydrological areas and the selected hydrological stations. I: Shifokou; II: Mubi; III: Xitaiyu; IV: Daomaguan; V: Fuping; VI: Dage; and VII: Lengkou.
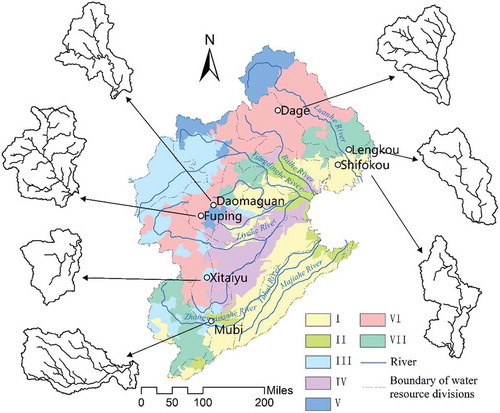
Figure 2. Remotely sensed land-use data of the Haihe River basin: (a) 1980 and (b) 2000.
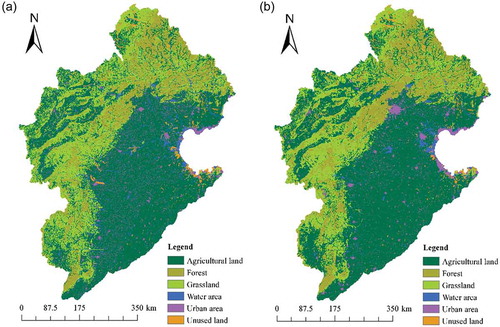
Figure 3. The ZWHM-LUCC model structure. P: precipitation; EM: evapotranspiration; UH: unit hydrograph.
Table 1. Trend and change point test results of flood characteristics for the seven study sub-catchments. Bold indicates significant trend and change point. Numbers indicate sub-catchments in . FV: flood volume.
Table 2. Area (km2) of each land-use type in 1980 and 2000 for each sub-catchment.
Table 3. Increased storage capacity of small hydraulic structures (converted to runoff depth) and deep soil moisture.
Table 4. Calibrated values of the main parameters for the Shifokou sub-catchment.
Table 5. Comparison of simulated and observed flood events in Shifokou sub-catchment. FVO and FVS: observed and simulated flood volume, respectively. FPO and FPS: observed and simulated mean flood peak, respectively. RE: relative error; NSE: Nash-Sutcliffe efficiency criterion.
Figure 4. Simulated (Δ) and observed (•) flood processes in Shifokou sub-catchment for flood events: (a) 670820 and (b) 700903.
Table 6. Effects of driving factors – groundwater depletion, land-use change and small hydraulic structures – on flood characteristics. FP: flood peak; FV: flood volume.