Figures & data
Figure 1. General layout of the study area showing the selected watersheds and location of the operative rain gauges with identification numbers listed in . The study watersheds are sub-basins of the Tiber River basin, Italy.
Table 1. Main characteristics of the selected rain gauge network. The geographical location is in Universal Transverse Mercator (UTM) coordinates determined by the WGS84 ellipsoid model. Identification (ID) numbers are as referred to in .
Table 2. Main characteristics (front typology and incoming direction of front deduced from the 700 mb wind) of the selected rainfall events. Rm: ensemble-averaged cumulative areal-average rainfall depth; σR: the corresponding standard deviation; CVR: the coefficient of variation; Rmin and Rmax: minimum and maximum cumulative areal-average rainfall depth; D: average duration of rainfall event.
Table 3. Relative identification number associated with the rain gauges operative in each watershed. The corresponding identification number used in is also given.
Figure 2. Comparison of the cumulative rainfall measured in the different stations of the Alto Tevere watershed for all the events that occurred between 29 November 2005 (event 1) and 7 December 2007 (event 30).
Figure 3. Comparison of the areal-average cumulative rainfall depth associated with the different selected watersheds for all the events that occurred between 4 May 2007(event 1) and 1 March 2009 (event 30).
Figure 4. Mean relative differences for each rain gauge (◊), ordered in each watershed by increasing value, with standard deviation (vertical bar): (a) Alto-Tevere, (b) Chiascio, (c) Topino-Marroggia, (d) Paglia-Chiani, (e) Nestore, (f) Medio Tevere, and (g) Nera. Labels refer to the relative identification numbers shown in and circles identify stations with the lowest values of γi (see ).
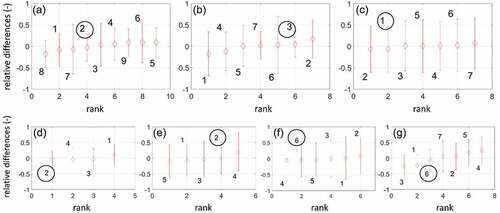
Figure 5. Map of the mean and standard deviation and σ(δi), respectively, obtained by the relative differences approach for each rain gauge operative in the study area.
Figure 6. Spearman rank correlation coefficient (rS, see text) for rainfall frontal systems observed during a 10-year period in the Alto Tevere watershed for events with spatially averaged cumulative rainfall: (a) less than 10 mm and (b) greater than 10 mm, and (c) for all the events.
Figure 7. Cumulative frequency of significant rainfall frontal systems (with specified front typology and incoming direction deduced from the 700 mb wind) characterized by the minimum and maximum values of the spatially averaged cumulative rainfall depth (>10 mm) observed in the watershed: (a) Alto Tevere (11–13 November 2012: warm, SW; 27–28 March 2008: other, S); (b) Chiascio (10–12 November 2013: other, SW; 24–25 December 2009: warm, SW); and (c) Topino-Marroggia (25–27 November 2005: cold, N; 9–10 March 2010: other, SW). The labels indicate the relative identification numbers of the rain gauges operative in the given watershed (see ).
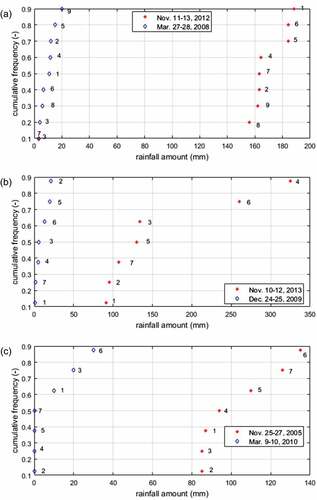
Table 4. Mean relative difference, , for each rain gauge operative in each watershed and the associated standard deviation, σ(δi), for events with cumulative areal-average rainfall,
, greater and less than 10 mm.
Table 5. Index of accuracy, γi, expressed (see EquationEquation (6)(6)
(6) ) through the mean relative difference and associated standard deviation, for each rain gauge operative in each watershed. All: all frontal systems considered (see ).
Figure 8. Cumulative rainfall depth represented by different combinations of measurements selected on the basis of the lowest values of the accuracy index given in vs mean areal cumulative rainfall, for the events with depth (a) less than and (b) greater than 10 mm. Nera watershed.
Table 6. Coefficient of determination, R2, associated with each watershed for the use of different combinations of representative stations defined through the temporal stability analysis. Combination 1 refers to the station with the lowest value of γi (see ); combination 2 refers to the first and second lowest values of γi; and combination 3 refers to the first, second and third lowest values of γi. Three groups of events put together on the basis of the cumulative areal-average rainfall depth, , are considered.
Figure 9. Mean areal cumulative rainfall depth approximated in each watershed by the more representative station vs its value derived from all the operative stations, for all observed frontal systems: (a) Alto-Tevere, (b) Chiascio, (c) Topino-Marroggia, (d) Paglia-Chiani, (e) Nestore, (f) Medio Tevere, and (g) Nera. The determination coefficients, R2, are also reported.
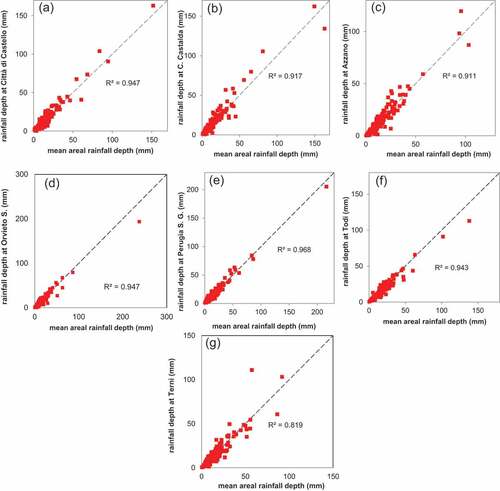
Figure 10. Mean areal cumulative rainfall depth approximated in each watershed by the two more representative stations vs its value derived from all the operative stations, for all observed frontal systems: (a) Alto-Tevere, (b) Chiascio, (c) Topino-Marroggia, (d) Paglia-Chiani, (e) Nestore, (f) Medio Tevere, and (g) Nera. The determination coefficients, R2, are also reported.
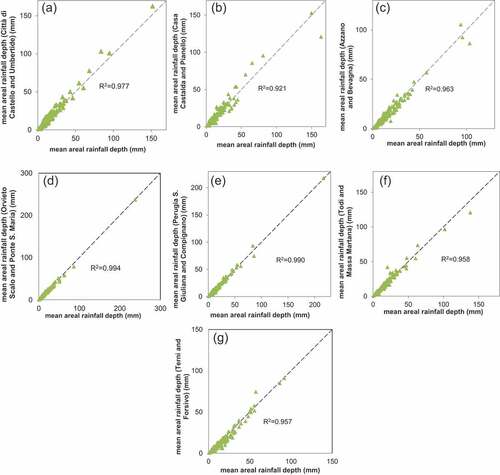
Figure 11. Map of the study area with the more representative rain gauge stations. Identification numbers are listed in .
Figure 12. Comparison of hyetographs deduced by all the gauges operative in a watershed and derived from the two best stations defined through the temporal stability analysis: (a) Alto Tevere, and (b) Chiascio.