
Figures & data
Figure 1. Location and digital elevation model of the Qingshui River Basin.
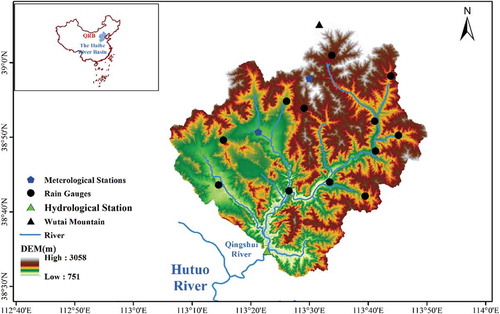
Figure 2. Land-use map of the QRB.
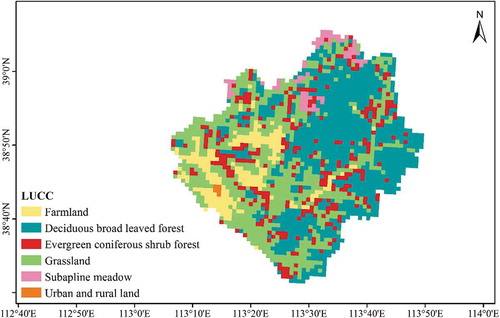
Figure 3. Vertical landscape belts in the QRB.
Figure 4. Simulation results of monthly streamflow in the QRB for (a) the calibration period (1960–1985) and (b) the validation period (1986–2000).
Figure 5. Comparison of annual evapotranspiration from WEP-L and MODIS in the QRB for the period 2001–2015.
Figure 6. Changes with elevation in mean value of (a) water cycle flux and (b) energy flux in the QRB for the period 1960–2015.
Figure 7. Changes with elevation in mean value of (a) water cycle flux coefficients and (b) energy flux ratios in the QRB for the period 1960–2015.
Table 1. Water cycle fluxes and energy fluxes for each vertical vegetation belt and the whole QRB for the period 1960–2015. Coniferous: evergreen coniferous shrub forest; Deciduous: deciduous broad-leaved forest.
Figure 8. Comparison of mean (a) water cycle flux and (b) energy flux for various vertical vegetation belts for the period 1960–2015.
Figure 9. Comparison of mean (a) water cycle flux coefficients and (b) energy flux ratio for various vertical vegetation belts for the period 1960–2015.
Table 2. Water balance for each vertical vegetation belt for the three study periods. Coniferous: Evergreen coniferous shrub forest; Deciduous: deciduous broad-leaved forest. ET: evapotranspiration.
Table 3. Results of the water cycle elements and runoff amounts under different simulated scenarios (1960–2015). Present: present land use; ‘All’ refers to the present land use of converted land in each case; the last three scenarios represent the conversion of present farmland to different land use. Change ratio is ratio of the difference between the changed scenario and the present scenario to the present scenario.