Figures & data
Figure 1. Typical sketch of flow structures at a river confluence (adapted from Zhou Citation2014).
Figure 2. Experimental flume system: (a) measurement sketch and (b) experimental test photo.
Table 1. Flow conditions and test parameters of the flume experiment.
Figure 3. Physical Model #1 – the river confluence between Baisha River and Shenxi River as the prototype: (a) model design, (b) prototype photo and (c) measurement section arrangement.
Table 2. Experimental test cases of flow discharges in Baisha River.
Table 3. Experimental test cases of flow discharge in Baisha and Shenxi rivers. Qp: prototype discharge, Qm: model discharge.
Figure 4. River confluence zone between Wahei River and Xianjia River as the prototype of physical Model #2: (a) sketch and (b) prototype photo.
Figure 5. Physical Model #2: (a) sketch of the measurement section arrangement and (b) photo of the experimental test.
Table 4. Settings and parameters of experimental test groups in physical Model #2. Qwp, Qxp prototype discharge; Qwm, Qxm: model discharge.
Figure 6. Measured u–v vector fields at the confluence zone in the flume experimental tests: (a) near surface (Z* = 0.09), (b) middle layer (Z* = 0.05), and (c) near bed (Z* = 0.018).
Figure 7. Flow structures and patterns at the confluence zone in the flume experiment: (a) contour plots of measured velocity fields at near-surface (Z* = 0.09), middle (Z* = 0.05) and near-bed (Z* = 0.018) locations, and (b) contour plot of measured water depth.
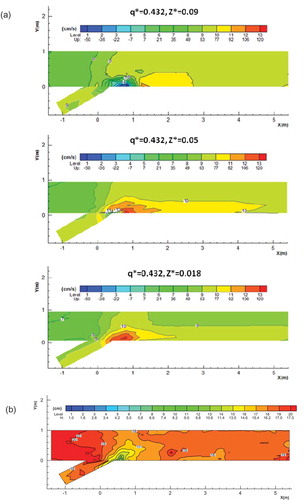
Figure 8. Mean vertical velocity distributions in the confluence zone.
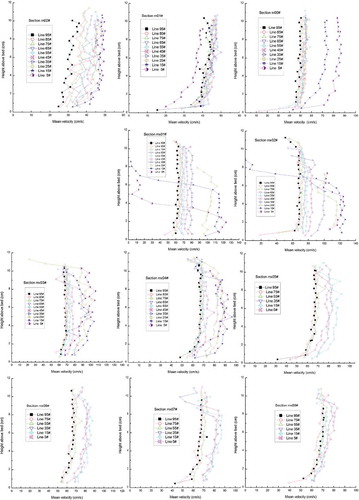
Figure 9. Measured stage–discharge relationships at different sections for physical Model #1 with and without tributary flows.
Figure 10. Longitudinal water level changes at the left bank of Baisha River for different inflows.
Table 5. Measured elevation of the water level (w.l.) and dyke at the test positions. QT: total discharge.
Figure 11. Measured stage–discharge relationships for physical Model #2 with different inflows.
Figure 12. Characteristics of water level variations in the confluence zone: variation of (a) transverse water level at five typical sections, and (b) longitudinal water level at typical positions from sections m02# to mx04#.
Figure 14. Comparison of measured and predicted stage–discharge relationships for Model #1.
Figure 13. Comparison of measured and predicted stage–discharge relationships for the laboratory experiment flume. Qc and Qcr refer to the predicted discharge based on the frictional slope by the uniform part only and both uniform and non-uniform parts (Equation (2)).