Figures & data
Figure 1. Location of the Pearl River Basin study area.
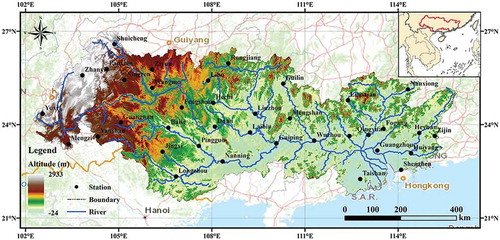
Figure 2. Relationship between the observed annual pan evaporation, ETpan, and calculated annual reference evapotranspiration, ETo.
Table 1. Correlation coefficients between interpolation result and observation data. IDW: inverse distance weighting; Ke: ordinary kriging with exponential variograms; Kl: universal kriging with linear drift variograms; Ks: ordinary kriging with spherical variogram. ETo: reference ET; RH: relative humidity; SD: sunshine duration; TAV: average temperature; WS: wind speed.
Figure 3. Variation of the annual ETo in the Pearl River Basin in the period 1960–2016.
Figure 4. Spatial distribution of the annual ETo in the Pearl River Basin.
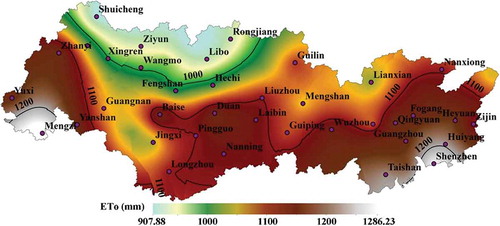
Figure 5. Monthly ETo in the Pearl River Basin.
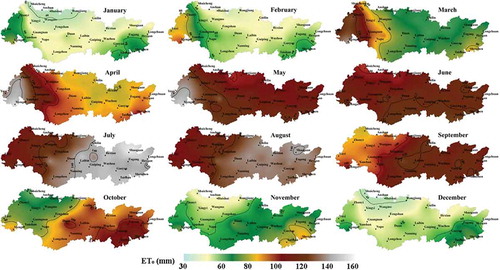
Table 2. Percentage of positive (PS) and negative (NE) trend region of basin and the change trend of ETo and climate variables in the PRB in the period 1960–2016. See for climate variable abbreviations./dec: per decade.
Figure 6. Spatial change trend of the ETo in the Pearl River Basin.
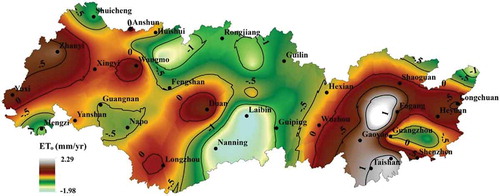
Figure 7. Relative change, RC, of climate variables in the Pearl River Basin. RH: relative humidity; SD: sunshine duration; TAV: average air temperature; WS: wind speed.
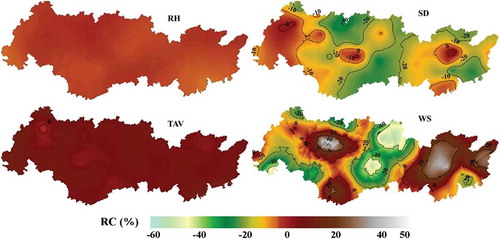
Figure 8. Monthly relative change, RC, sensitivity coefficient, Sen, and contribution, Con, of the climate variables in the Pearl River Basin.
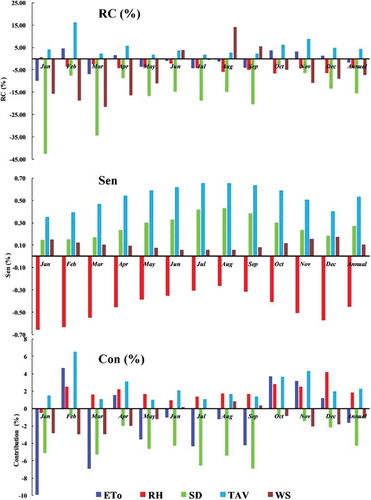
Figure 9. Sensitivity coefficient (absolute) between ETo and climate variables in the Pearl River Basin. RH: relative humidity; SD: sunshine duration; TAV: average air temperature; WS: wind speed.
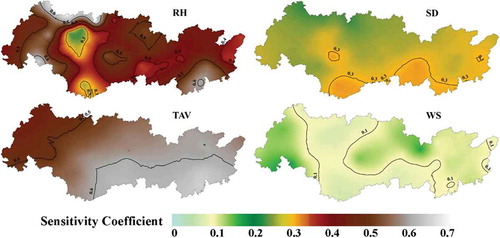
Figure 10. Contribution between ETo and climate variables in the Pearl River Basin. RH: relative humidity; SD: sunshine duration; TAV: average air temperature; WS: wind speed.
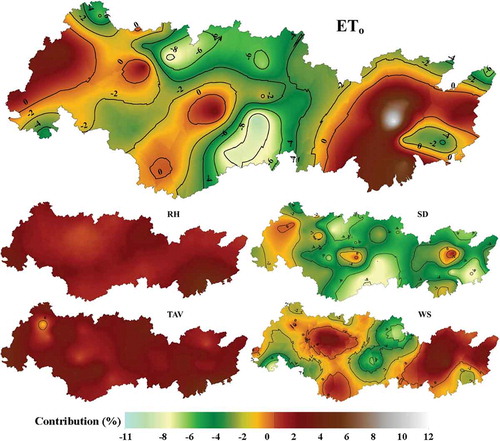
Table 3. Percentage of area influenced by each dominant variable to ETo (%).
Figure 11. Variation of ETo and climate variables in the Pearl River Basin. RH: relative humidity; SD: sunshine duration; TAV: average air temperature; WS: wind speed.