Figures & data
Figure 1. Location of the Hotan River Basin in the arid region of northwest China, showing sounding stations, as well as Wuluwati and Tongguziluoke hydrological stations.
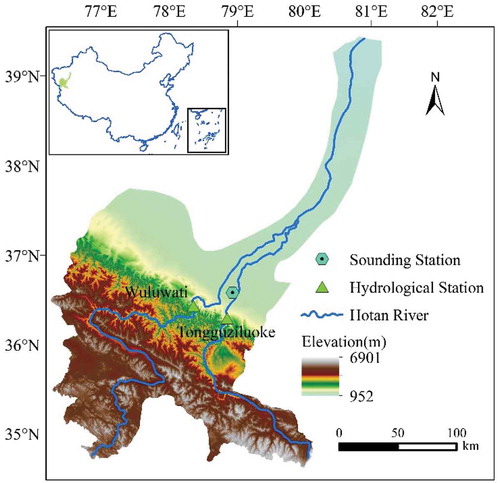
Figure 2. Schematic of the back-propagation training process.
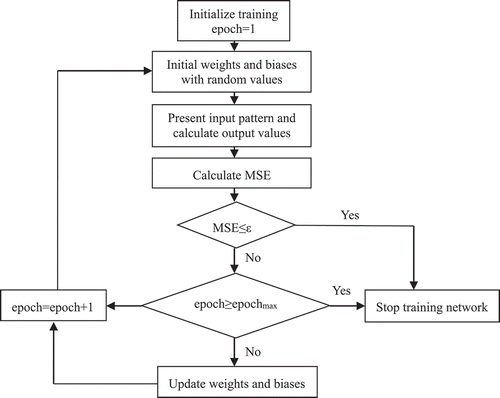
Figure 3. Flowchart of the runoff prediction model based on the ESMD-BPANN algorithm.
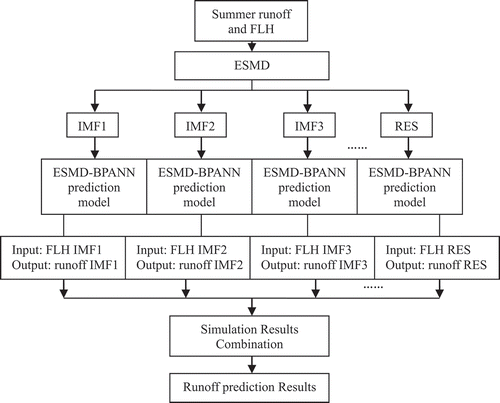
Figure 4. Time series of summer runoff and FLH in the Hotan River from 1960 to 2013.
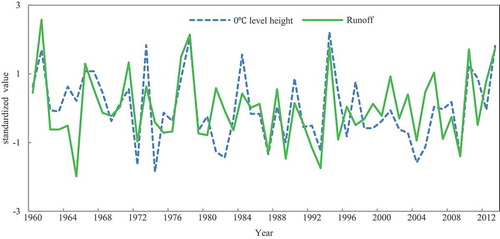
Figure 5. Variation patterns of summer runoff and FLH decomposed by wavelet analysis at different time scales.
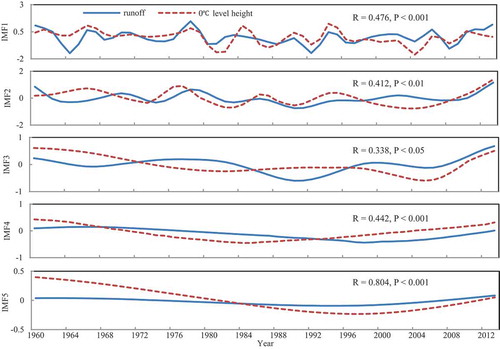
Table 1. The period and contribution rates of EEMD decomposition for the summer runoff and FLH for the period 1960–2013 in the Hotan River. IMF: intrinsic mode function; RES: residual.
Figure 6. The intrinsic mode functions IMF1–4 and trend components of summer runoff and FLH from 1960 to 2013 in the Hotan River using the EEMD method.
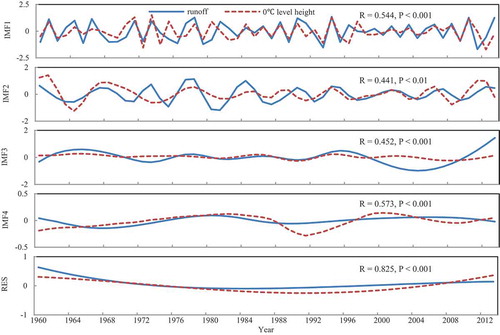
Table 2. The period and contribution rates of ESMD decomposition for the summer runoff and FLH for the period 1960–2013 in the Hotan River. IMF: intrinsic mode function; RES: residual.
Figure 7. The intrinsic mode functions IMF1–3 and trend components of summer runoff and FLH from 1960 to 2013 in the Hotan River using the ESMD method.
Figure 8. Comparison between the observed data of runoff and its simulated values based on single MLR and BPANN for calibration (1960–2001) and validation (2002–2013) periods.
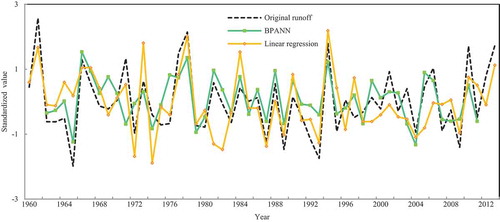
Table 3. Comparison between single model and hybrid models of MLR and nonlinear decomposition methods for calibration (1960–2001) and validation (2002–2013). Bold indicates the best performance.
Figure 9. Comparison between the observed data of runoff and its simulated values based on the hybrid models of MLR and nonlinear decomposition methods for calibration (1960–2001) and validation (2002–2013).
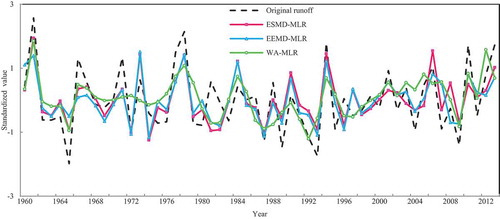
Figure 10. Predictive QQ plots obtained based on the prediction distributions generated using the single MLR and the hybrid models of MLR combined with nonlinear decomposition methods for (a) the calibration period (1960–2001) and (b) the validation period (2002–2013).
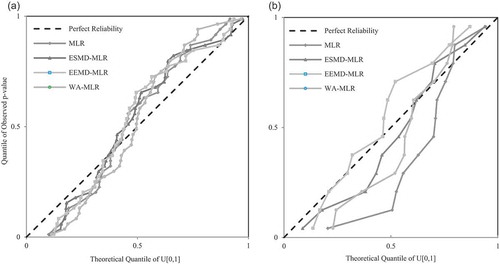
Table 4. Comparison between single model and hybrid models of BPANN and nonlinear decomposition methods for calibration (1962–2001) and validation (2002–2011). Bold indicates best performance.
Figure 11. Comparison between the observed data of runoff and its simulated values based on the hybrid models of BPANN and nonlinear decomposition methods for calibration (1962–2001) and validation (2002–2011) periods.
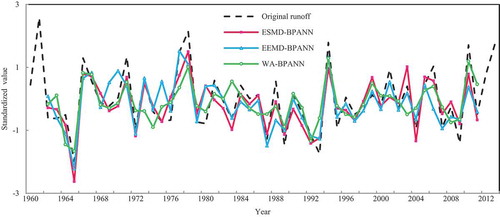
Figure 12. Predictive QQ plots obtained based on the prediction distributions generated using the single BPANN and hybrid models of BPANN combined with nonlinear decomposition methods for (a) the calibration (1962–2001) period and (b) the validation period (2002–2011).
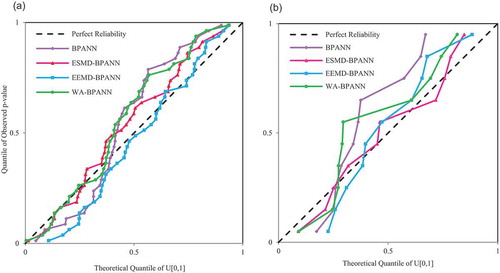
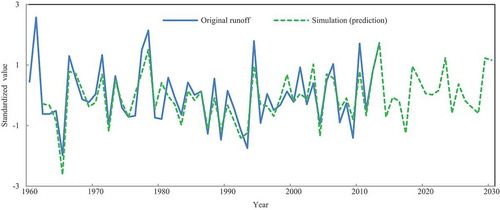
Figure 13. Projected runoff in the Hotan River by the hybrid model ESMD-BPANN for the period 2014–2030.