Figures & data
Table 1. Main features of the Aghien Lagoon and its catchment.
Figure 1. Study area, instrumentation and piezometric contour (ONEP, pers. comm.) of the Aghien hydrosystem.
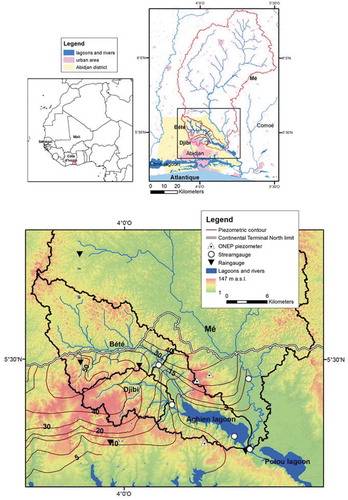
Figure 2. Rainfall, discharge time series for the Djibi, Bété and Mé rivers and daily Aghien Lagoon water levels. The dates of the water quality surveys are shown by the red and blue dots on the curves.
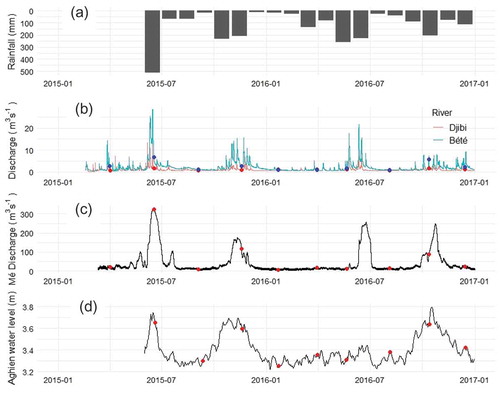
Figure 3. Diagrammatic representation of the nine sampling sites on the Aghien hydrosystem (red circles for gauging stations).
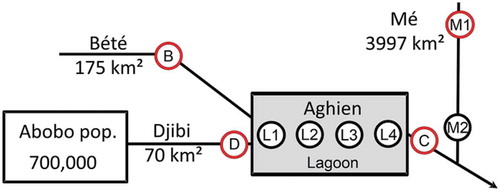
Table 2. Annual rainfall and streamflow in the three catchments (in brackets: streamflow-rainfall ratio).
Figure 4. (a) ADCP discharge measurements in the Aghien-Potou channel versus discharge calculated from the water balance equation considering no groundwater exfiltration. (b) Example of observed and calculated discharge on 26 May 2016. Due to the tide oscillation, the flow direction changes twice a day: channel discharge is positive when the flow is out of the lagoon.
Figure 5. Box-and-whisker plots summarizing the physical-chemical parameters, total nitrogen (TN), ammonium (N-NH4), nitrite (N-NO3), nitrate (N-NO2), total phosphorus (TP) and SRP concentrations at the nine sampling sites in the Aghien hydrosystem. Boxes indicate the interquartile range (IQR) around the median; whiskers indicate the maximum and minimum values, excluding outliers (dot: values more than 1.5 × IQR).
Figure 6. Instantaneous total nitrogen (TN) and total phosphorus (TP) fluxes in the Bété, Djibi and Mé river sites (hatched boxes: high flow conditions, HFC).
Table 3. Physico-chemical parameters of the Bété river (B), Djibi river (D), Mé river (M1, M2) and Aghien Lagoon (L1–L4). Shaded discharge cells indicate sampling under high-flow conditions. DO: dissolved oxygen; TN: total nitrogen; TP: total phosphorus.
Table 4. Total nitrogen and total phosphorus fluxes between June 2015 and December 2016, calculated using four different methods (see the section on “Nutrients fluxes”).
Figure 7. (a) Calculated channel discharge (Ch1, Ch2) versus channel discharge measurements for two values of groundwater hydraulic conductivity (Ch1: 10−4 m s−1; Ch2: 10−3 m s-1). (b) Example for an inflow period. Channel discharge is positive when the flow is out of the lagoon.
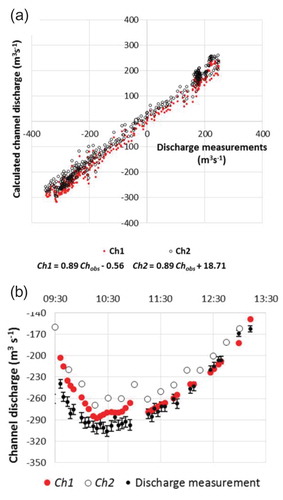
Figure 8. Monthly channel flow in and out of the Aghien Lagoon deduced from the water budget of the Aghien Lagoon.
Figure 9. Monthly components of the lagoon water budget: (a) for 2015 and (b) for 2016. Values are positive for contributions to the lagoon. Groundwater exfiltration is obtained with a hydraulic conductivity fixed at 10−4 m s−1.
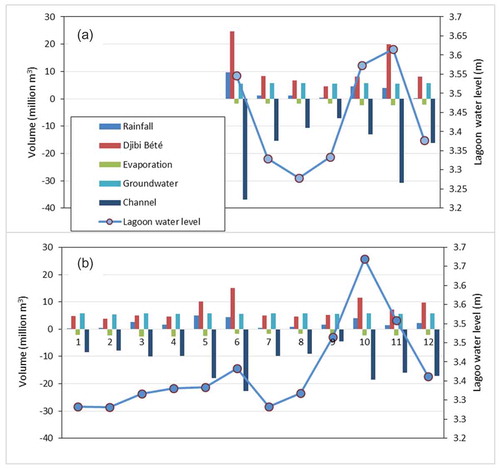
Figure 10. Point discharge survey at the Mé confluence in July 2017 during outflow and inflow phases (discharge is given in m3 s−1, circles represent the gauging sections around the confluence).
Figure 11. Water quality status at the study sites (M1: Mé river; B: Bété river; D: Djibi river).
Figure 12. Total phosphorus (TP) load versus total nitrogen (TN) load for the Bété (B), Djibi (D) and Mé (M) rivers compared to load in forested, rural and urban catchments.
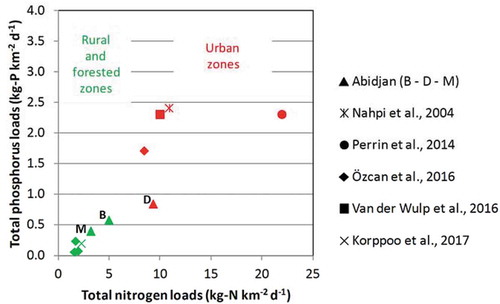
Figure A1. Rating curves of the Bété, Djibi and Mé (M1) streamgauge stations.